
Figure 3.
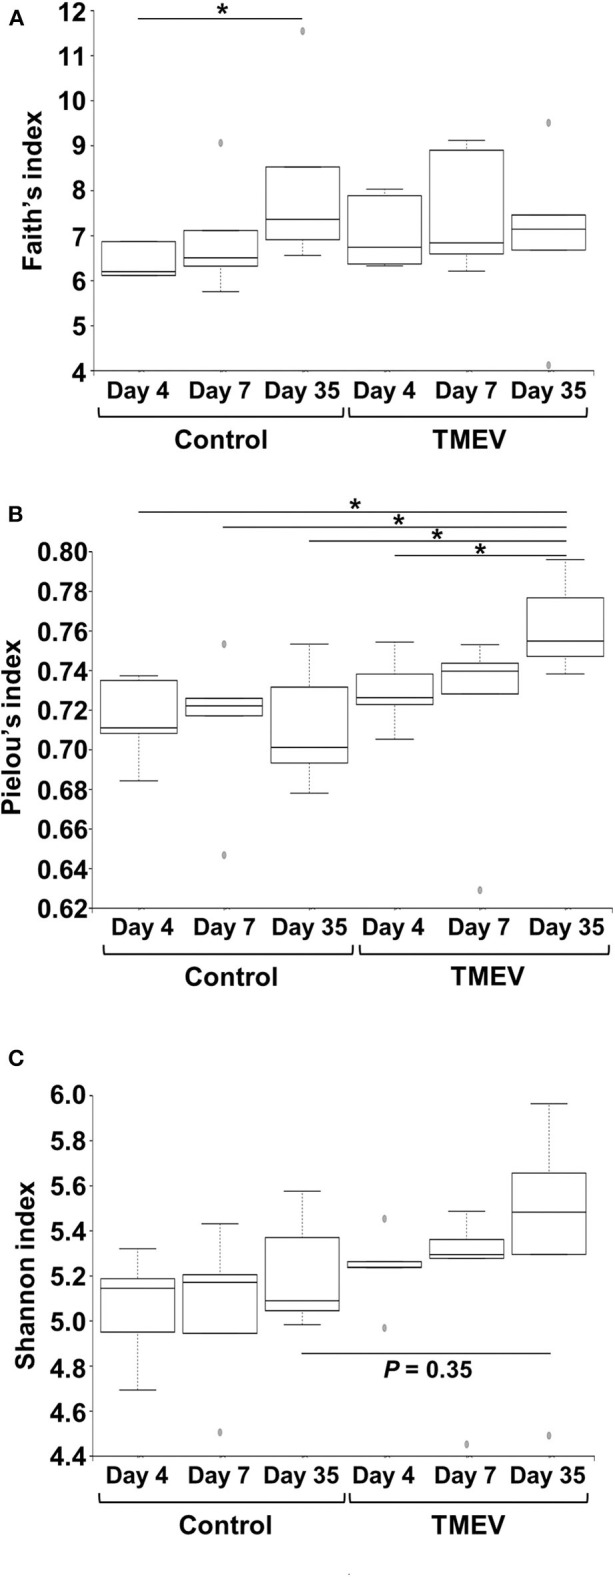
Time course analyses of bacterial alpha diversities of microbiome among TMEV-infected and control groups. Using QIIME 2, we compared the number of genera, evenness, and the combination of them between the groups (n = 5) by Faith's phylogenetic diversity index (A), Pielou's evenness index (B), and Shannon index (C), respectively. (A) The numbers of bacterial genera differed significantly only between control groups days 4 and 35 (*P < 0.05, ANOVA). (B) We found significantly increased evenness in the TMEV-infected group on day 35 compared with all the other groups (*P < 0.05, ANOVA). (C) We found increased Shannon indices in TMEV-infected groups over the time course, but no statistical differences between the groups (P = 0.35, control vs. TMEV groups on day 35).