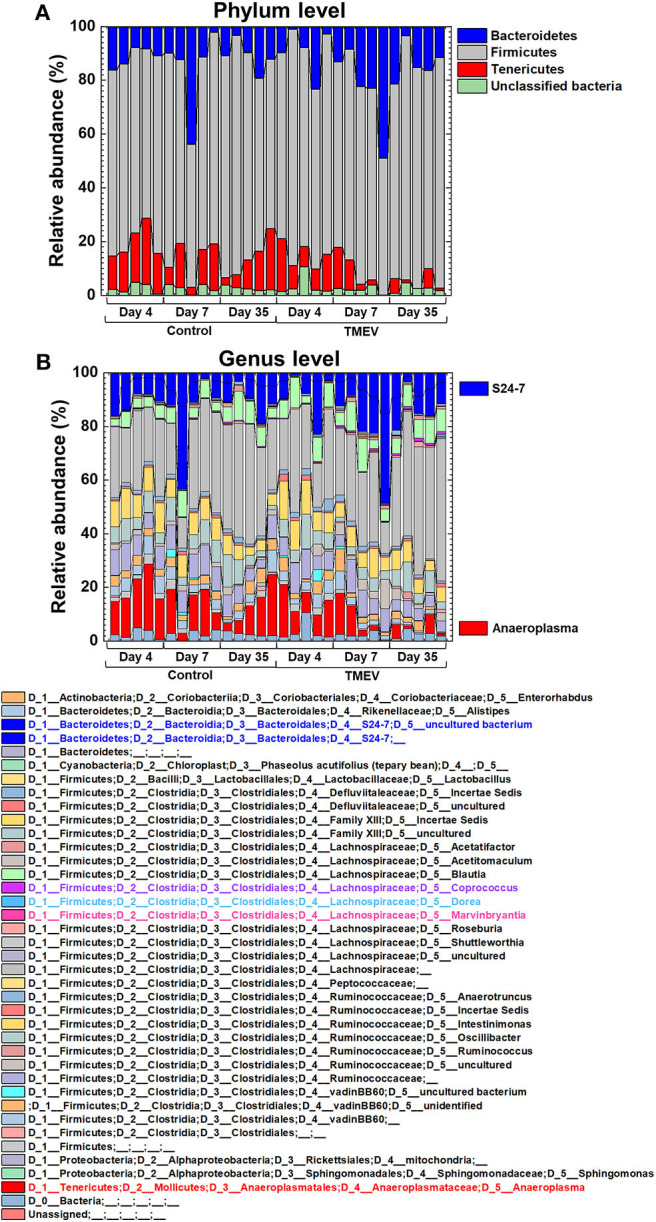
Figure 4.

Relative abundance of fecal bacteria in the TMEV-infected and control groups. Fecal DNA was extracted and analyzed the microbiome by 16S rRNA sequencing. (A) At the phylum level, Bacteroidetes (blue) and Tenericutes (red) seemed to be increased and decreased in the TMEV-infected groups, respectively, without statistical differences. (B) At the genus level, on day 35, two taxa of the family S24-7 (blue) and the genus Anaeroplasma (red) seemed to be increased and decreased in the TMEV-infected group, respectively, without statistical differences.
