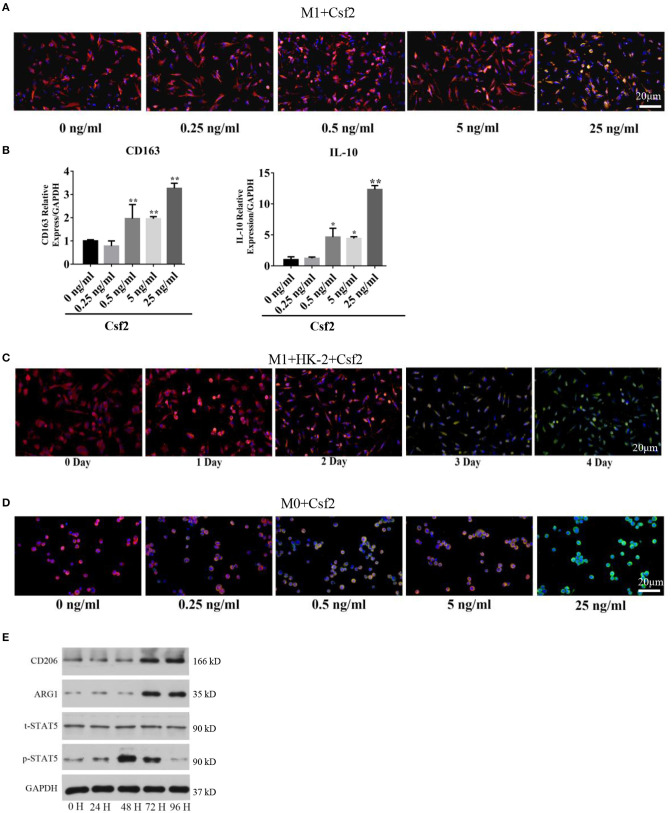
Figure 3.
Csf2 mediated alternative activation via the p-STAT5 pathway. (A) Representative immunofluorescence images of M1 macrophages showing the expression of HLA-DR (red, M1 marker) and CD206 (green, M2 marker) with Csf2 stimulation at different doses for 48 h. Slides were directly visualized using an Olympus fluorescence microscope at a 20X magnification, scale bar = 20 μm. (B) qRT-PCR was used to detect the mRNA levels of CD163 and IL-10 in M1 macrophages exposed to different doses of Csf2. Data are the mean ± SD of three separate experiments. The significance of differences was tested using Student's t-test. *p < 0.05. (C) Representative immunofluorescence images of M1 macrophages showing the expression of HLA-DR (red, M1 marker) and CD206 (green, M2 marker) after coculture with LPS-HK-2 for 4 days. Slides were directly visualized using an Olympus fluorescence microscope at a 20X magnification, scale bar = 20 μm. (D) Representative immunofluorescence images of M0 macrophages showing the expression of CD68 (red, M0 marker) and CD206 (green, M2 marker) following Csf2 stimulation at different doses for 48 h. Slides were directly visualized using an Olympus fluorescence microscope at a 20X magnification, scale bar = 20 μm. (E) Western blot analysis was used to detect CD206 (M2 marker), ARG1 (M2 marker), total STAT5 and phosphorylated STAT5 in M1 macrophages at the indicated times. Three independent experiments were performed.

