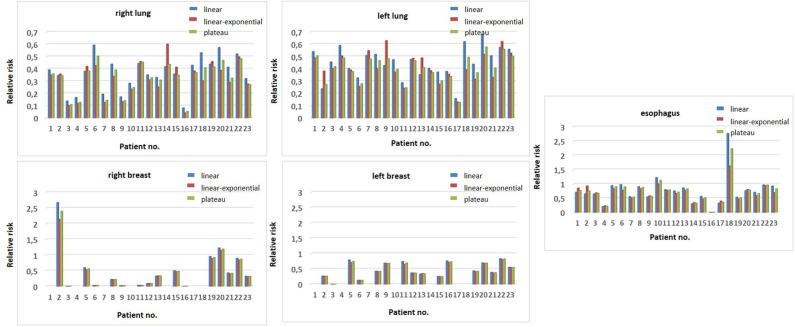
Figure 2.
Relative risk reduction for the three distinct dose-response relationship models (linear in blue, the linear-exponential in red and the plateau model in green) according to the Schneider model. Calculated relative risks for tumor induction are shown for relevant thoracic organs (right and left lung, esophagus, right, and left breast) for each patient.

