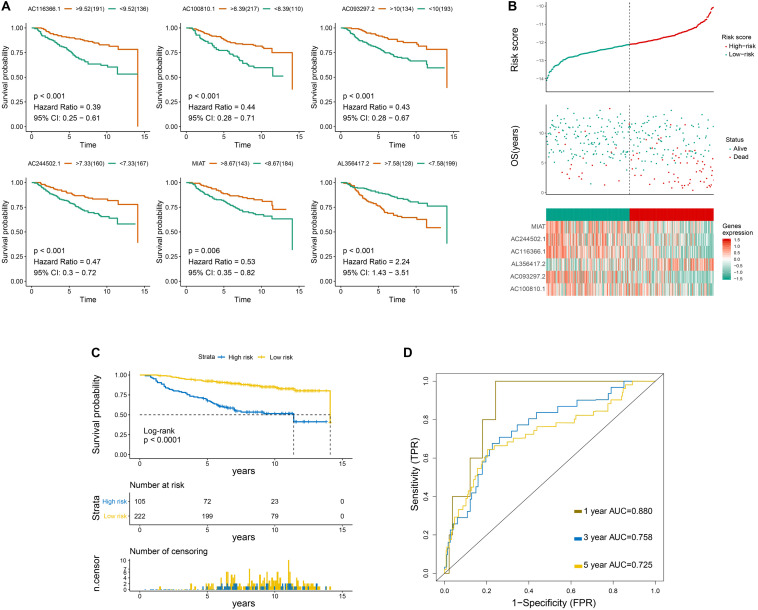
FIGURE 2.
Primary evaluation of the six-LncRNA Signature in the Training Set. (A) Overall survival curves of six lncRNAs. (B) From top to bottom are the risk score, survival status distribution, and six-lncRNA expression level of each patient. (C) Overall survival curves of the prognostic signature, in which the blue line represents the high-risk subgroup and the yellow line represents the low-risk subgroup. (D) The 1-, 3-, and 5-year survival receiver operating characteristic curves.

