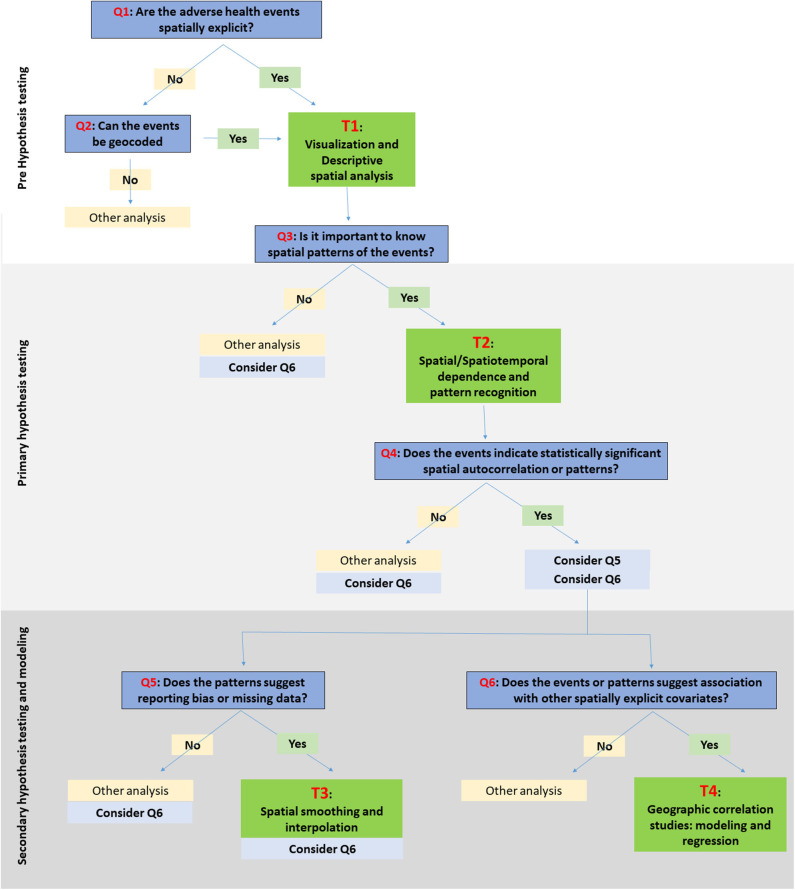
Figure 1.
Schematic illustration of a framework for choosing spatiotemporal visualization and analytical tools (SATs). The research questions/objectives are identified with Q1:Q6. The specific SATs under the relevant categories, i.e., T1:T4, are listed in Table 1.

