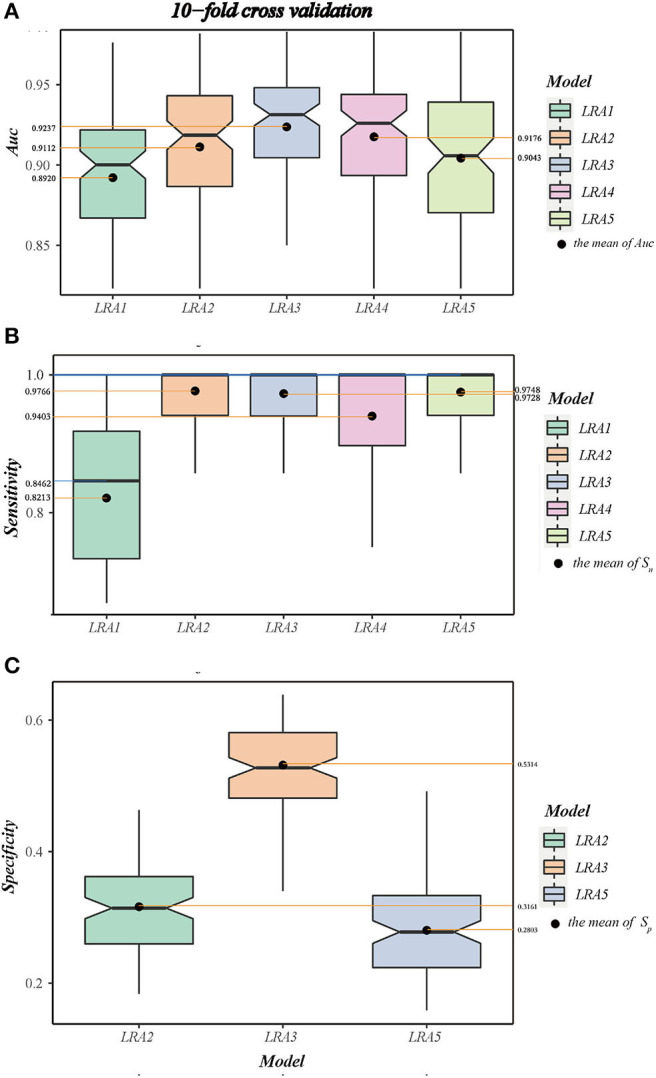
Figure 5.

(A) The boxplot A shows the area under curve (AUC) and value interval and relative stability of the LRA1–LRA5 models after 10-fold cross-validation. (B) The boxplot B shows the median and mean sensitivity, value interval, and relative stability of the LRA1–LRA5 models after 10-fold cross-validation. (C) The boxplot C shows the specificity and value interval and relative stability of the LRA2, LRA3, LRA5 models after 10-fold cross-validation.
