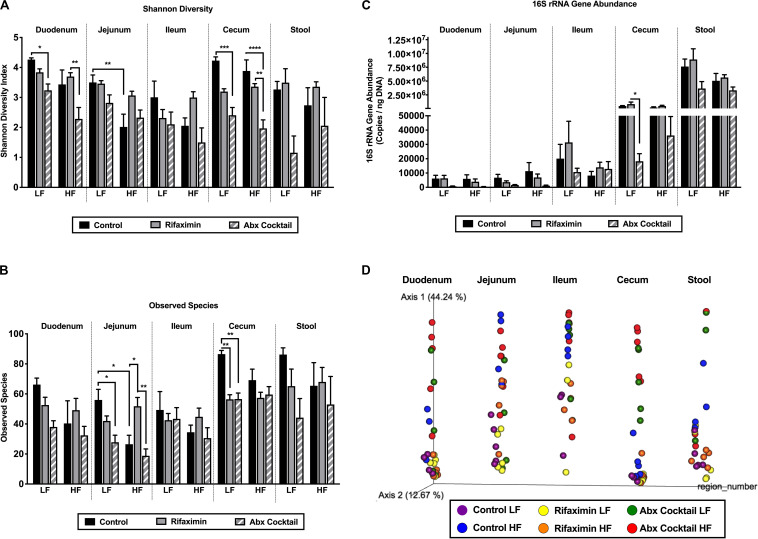
FIGURE 3.
Diet and antibiotics differentially impact the gut microbiota along the length of the gut. C57Bl6 mice were fed a low fat (LF) or high fat (HF) diet and treated with vehicle control, rifaximin or an antibiotic (Abx) cocktail for 4 weeks. (A) Shannon diversity is shown for all gut regions. (B) The number of observed species is shown. (C) 16S rRNA gene abundance is shown. (D) A PCoA plot based on Bray Curtis dissimilarity index and on a forced axis for region is shown. See Supplementary Figure 1 for PCoAs ploted on a forced axis for diet and antibiotics and Supplementary Figure 2 for diet comparisons within each antibiotic treatment condition. Results from two-way adonis tests are shown in Supplementary Table 1 and pairwise comparisons are shown in Supplementary Table 2. Data are shown as means ± SEM; n = 5 per group; *p < 0.05, **p < 0.01, ***p < 0.001, ****p < 0.0001.

