Figure 1.
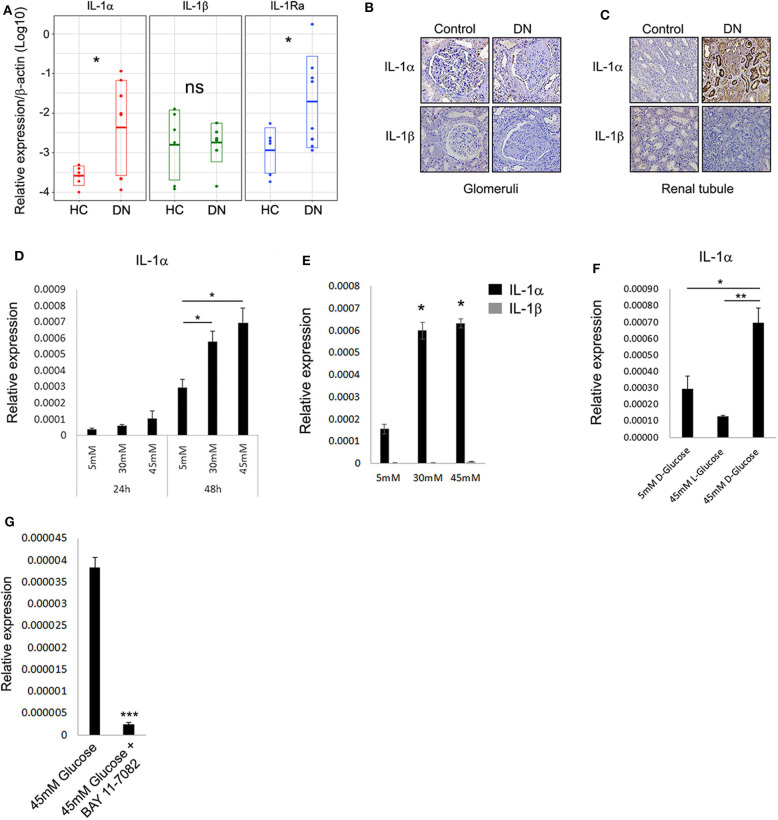
Interleukin 1α is highly expressed in renal tubular epithelial cells of patients with diabetic kidney disease. (A) Gene expression data of IL-1 genes transcripts: IL-1α, IL-1β, and IL-1Ra. Total RNA extracted from paraffin-embedded whole sections of kidney biopsies of DN and HC donors and assessed using qPCR. Data are expressed as log2-normalized relative expression to the housekeeping gene β-actin. Snapshots of represented immunohistochemistry staining of the same kidney biopsies of DN and HC donors [as in panel (A)] using human-specific monoclonal antibodies against human IL-1α and IL-1β, panel (B) shows glomeruli, whereas panel (C) shows renal tubule. Upper panels show IL-1α, and lower panels show IL-1β. Brown staining indicates the presence of the target antigen. (D) Interleukin 1α expression is upregulated in response to HG concentrations. The human proximal tubular kidney cells HK-2 exposed to gradual glucose concentrations for 24 or 48 h. Interleukin 1α gene expression was evaluated using qPCR and expressed as normalized relative expression to the human housekeeping gene β-actin. (E) Interleukin 1β expression is not induced in response to HG concentrations. HK-2 cells were exposed to gradual glucose concentrations for 48 h. The expressions of IL-1α and IL-1β were monitored as in panel (E). (F) HK-2 cells were exposed to low (5 mM), high (45 mM), d-glucose, or l-glucose (45 mM) concentrations for 48 h. The expression of IL-1α transcripts was evaluated using qPCR as in panel (E). (G) The overexpression of IL-1α in response to HG concentration can be abolished by NF-κB inhibition. HK-2 cells were exposed to HG concentrations for 48 h with or without the presence of 5 μM/mL of BAY 11-7082 NF-κB irreversible inhibitor. The expression of IL-1α was monitored as in panel (E). t test p values: *p < 0.05, **p < 0.01, ***p < 0.001.

