
FIGURE 3.
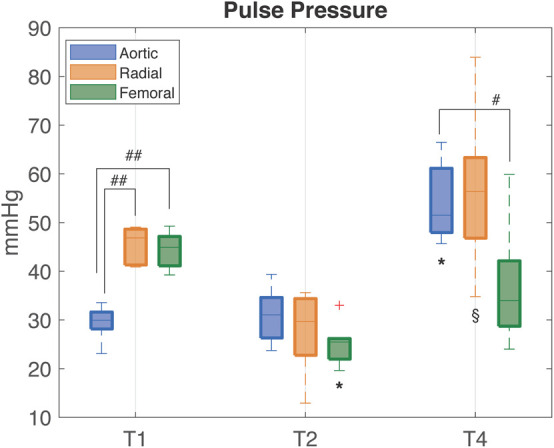
Distribution (median [25th, 75th percentile]) of PP values computed from aortic (blue), radial (orange), and femoral (green) ABP waveforms at each time point of the experiment. T1, baseline; T2, after development of septic shock; T4, after resuscitation with fluids and noradrenaline. Wilcoxon signed test: ∗p-value < 0.05 with respect to T1, § p-value < 0.05 with respect to T2 (Friedman test p-value < 0.05). Mann–Whitney U-test: #p-value < 0.05 between the specified variables.##p-value < 0.01.