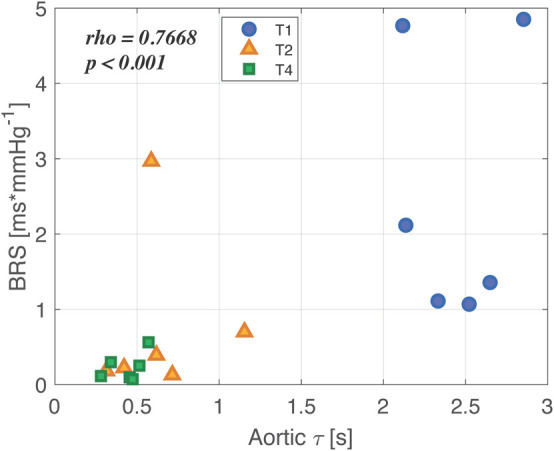
FIGURE 6.

Correlation between characteristic time constant τ computed in aorta and baroreflex sensitivity (BRS) throughout the overall experiment. Baseline values (T1) are represented as blue circles, shock values (T2) as orange triangles, and values after full resuscitation with fluids and noradrenaline (T4) are reported as green small squares. In the upper left corner, the correlation coefficient and the p-value are reported.
