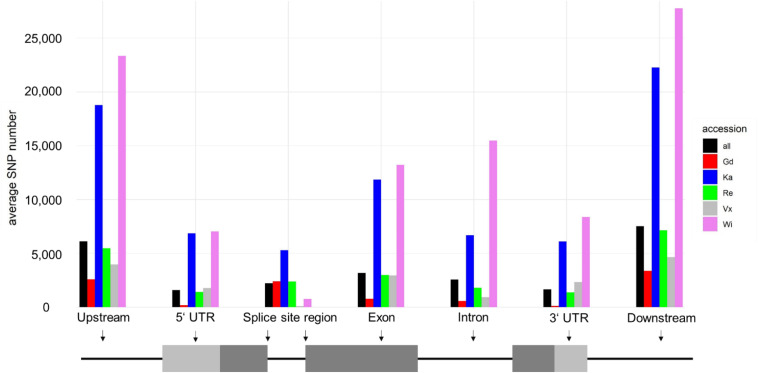
FIGURE 2.
Average snpEff output for each accession. Shown are average numbers of SNPs affecting specific regions, highlighted in a schematic gene structure shown below the corresponding grouped columns. Most SNPs are up- and downstream of genes (intergenic). SNPs at splice site regions are intron SNPs, located on the first and last two intron base pairs.

