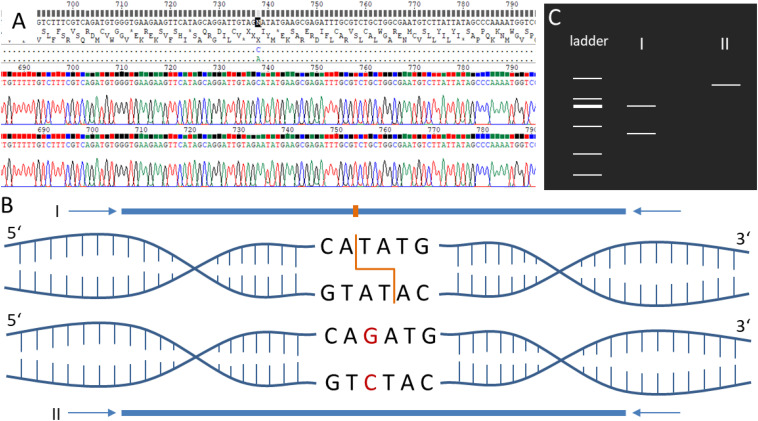
FIGURE 6.
Schematic visualization of the restriction fragment length polymorphism (RFLP) analysis. (A) Electropherogram of the sequenced amplicons generated via PCR using forward and reverse primers. (B) PCR amplicons of the samples I and II covering the same genomic position in two different P. patens accessions. Sample I sequence includes a restriction enzyme site for NdeI (orange). Sample II contains a single nucleotide polymorphism (SNP, red) resulting in the loss of the restriction enzyme site. (C) If amplicons are digested via the corresponding restriction enzyme NdeI, sample I results in two bands when separated via gel electrophoresis, whereas sample II results in one band. See Supplementary Figures S13–S15 for experimental verification of the accession-specific RFLP regions.

