Figure 2.

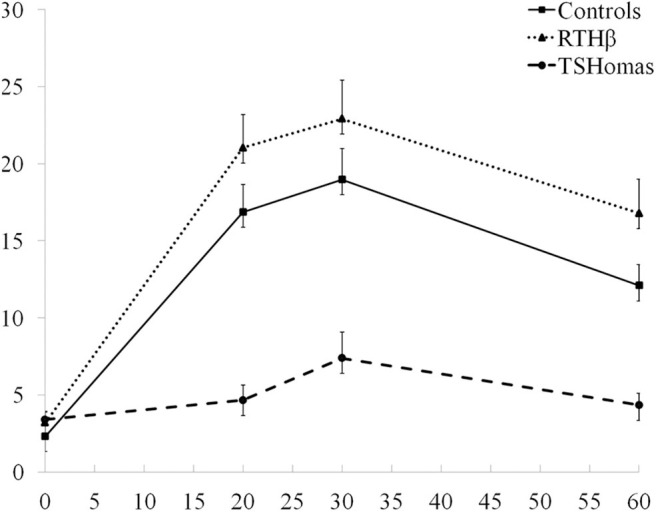
TRH stimulation test results. The three curves represent the mean TSH values ± SEM at baseline, 20, 30, and 60 min after TRH injection in TSHoma and RTHβ patients and controls.

TRH stimulation test results. The three curves represent the mean TSH values ± SEM at baseline, 20, 30, and 60 min after TRH injection in TSHoma and RTHβ patients and controls.