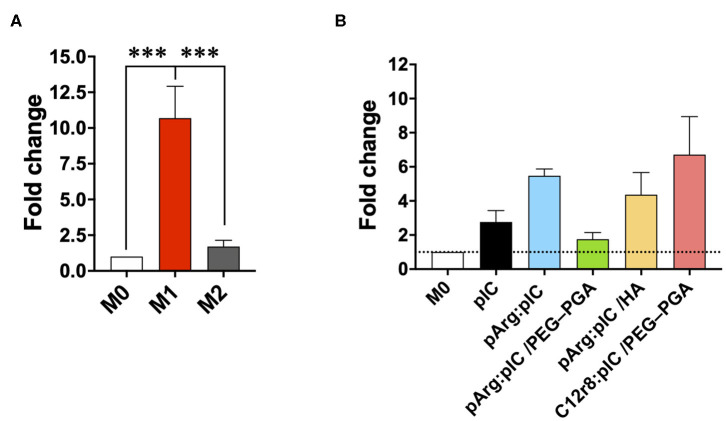
Figure 5.
mRNA production of different M1/M2 associated factors. Fold change in the mRNA levels of IRF7 in (A) prototypic M1/M2 macrophages and in (B) M0 macrophages treated with the different nanocomplexes after 8 h of incubation. The dose of poly(I:C) was 5 μg/mL. Values represent mean ± SD (N = 4). Statistical comparison was done using an ordinary one-way ANOVA followed by a Tukey's comparison test between groups. Statistically significant differences are represented as ***p < 0.005. C12r8, laurate-octaarginine; HA, hyaluronic acid; pArg, poly-arginine; PEG–PGA, pegylated polyglutamic acid; pIC, poly(I:C).

