FIGURE 5.

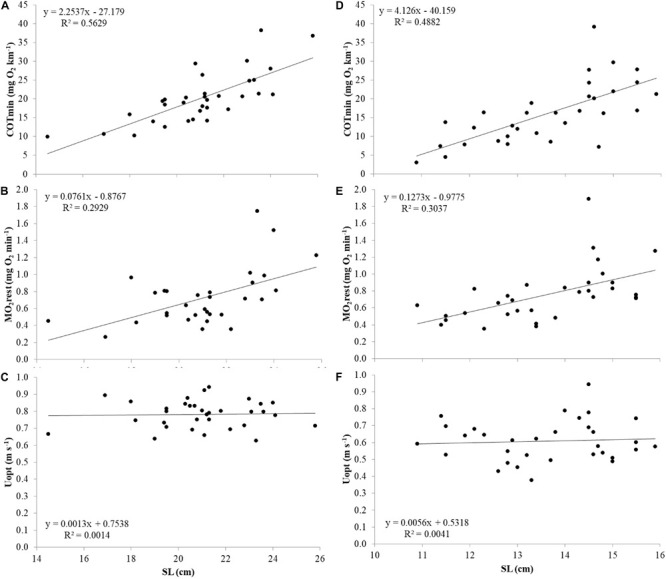
COTmin (mg O2 km–1), MO2 rest (mg O2 min–1), and Uopt (m s–1) in relation to SL from top to bottom in Atlantic salmon (A–C) and Gilthead seabream (D–F).

COTmin (mg O2 km–1), MO2 rest (mg O2 min–1), and Uopt (m s–1) in relation to SL from top to bottom in Atlantic salmon (A–C) and Gilthead seabream (D–F).