
FIGURE 6.
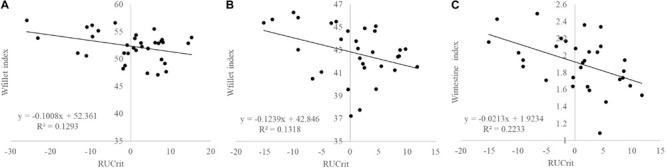
Correlations between RUcrit and (A) Wfilet index in Atlantic salmon (P = 0.125), (B) and Gilthead seabream (P = 0.034), and (C), and Wintestine index in Gilthead seabream (P = 0.008).
Official websites use .gov
A
.gov website belongs to an official
government organization in the United States.
Secure .gov websites use HTTPS
A lock (
) or https:// means you've safely
connected to the .gov website. Share sensitive
information only on official, secure websites.
Correlations between RUcrit and (A) Wfilet index in Atlantic salmon (P = 0.125), (B) and Gilthead seabream (P = 0.034), and (C), and Wintestine index in Gilthead seabream (P = 0.008).