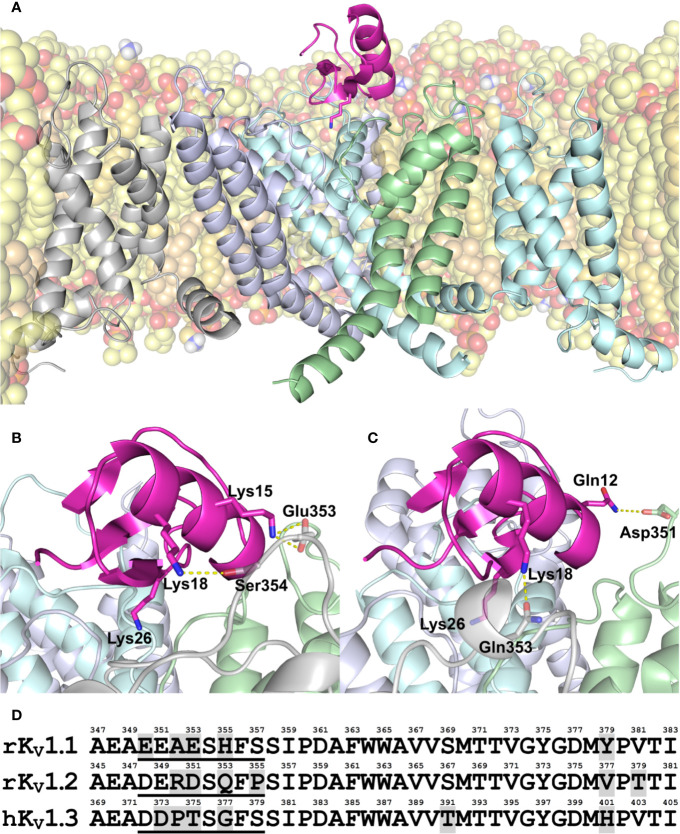
Figure 1.
(A–C) Modeled structure of MeKTx13-3 in complex with KV1.1–1.3. (A) Overall structure of the KV1.3–MeKTx13-3 complex after 100-ns MD simulation inside a hydrated lipid bilayer membrane. Four channel α-subunits with identical sequences are color-coded. The pore domain helices of the channel subunit in the foreground and voltage-sensing domain (VSD) of the adjacent subunit, as well as extended extracellular loops of the VSDs are omitted for clarity. Lipids are shown in a semi-transparent space-filling representation; atoms are colored: oxygen, red; phosphorus, orange; nitrogen, blue; hydrogen of amino group, white; carbon of POPC, light-yellow; carbon of POPE, yellow; and carbon of cholesterol, beige. Some lipids are omitted for clarity. MeKTx13-3 is presented in pink; residue Lys26 (plugs the channel pore) is shown as sticks. (B, C) Close-up view on the channel pore vestibule area in complexes KV1.1–MeKTx13-3 and KV1.2–MeKTx13-3, respectively. Channels are shown in a semi-transparent representation. Lys26 and residues involved in the intermolecular contacts not present in the KV1.3–MeKTx13-3 complex are shown as sticks. Hydrogen bonds and salt bridges are shown as dashed yellow lines. Lipids are omitted for clarity. (D) Amino acid sequence alignment of the extracellular pore region of KV1.1–1.3 channels. Residue numbering is above each sequence; different residues are shaded gray; sequences of S5-P loops containing channel-specific residues are underlined.

