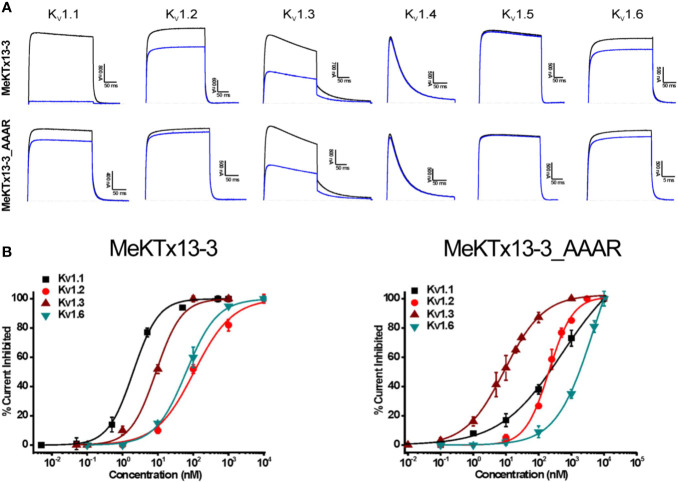
Figure 3.
Electrophysiological profiling of MeKTx13-3 and MeKTx13-3_AAAR activities. (A) Representative traces of currents through KV1.1–1.6 in control (black) and after application of 10 nM toxin (blue). (B) Concentration–response curves of MeKTx13-3 (left) and MeKTx13-3_AAAR (right) on KV1.1–1.3 and 1.6 obtained by electrophysiological measurements. IC50 values are listed in Table 1.

