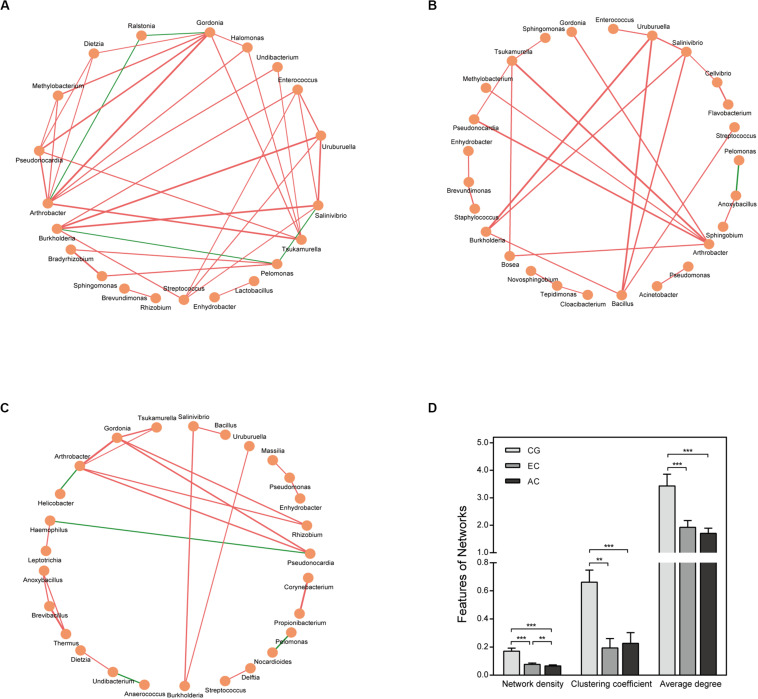
FIGURE 4.
Correlation network of the gastric microbiome. The correlation coefficient was calculated with Spearman’s rank correlation test (| r| ≥ 0.6). Cytoscape version 3.7.1 was used for network construction. Correlation networks in CG (A), EC (B), and AC (C); (D) Comparison of network features between CG and EC. Red and green lines represent positive and negative correlations, respectively. The thickness of the lines represents the size of the correlation. **p < 0.01; ***p < 0.001.

