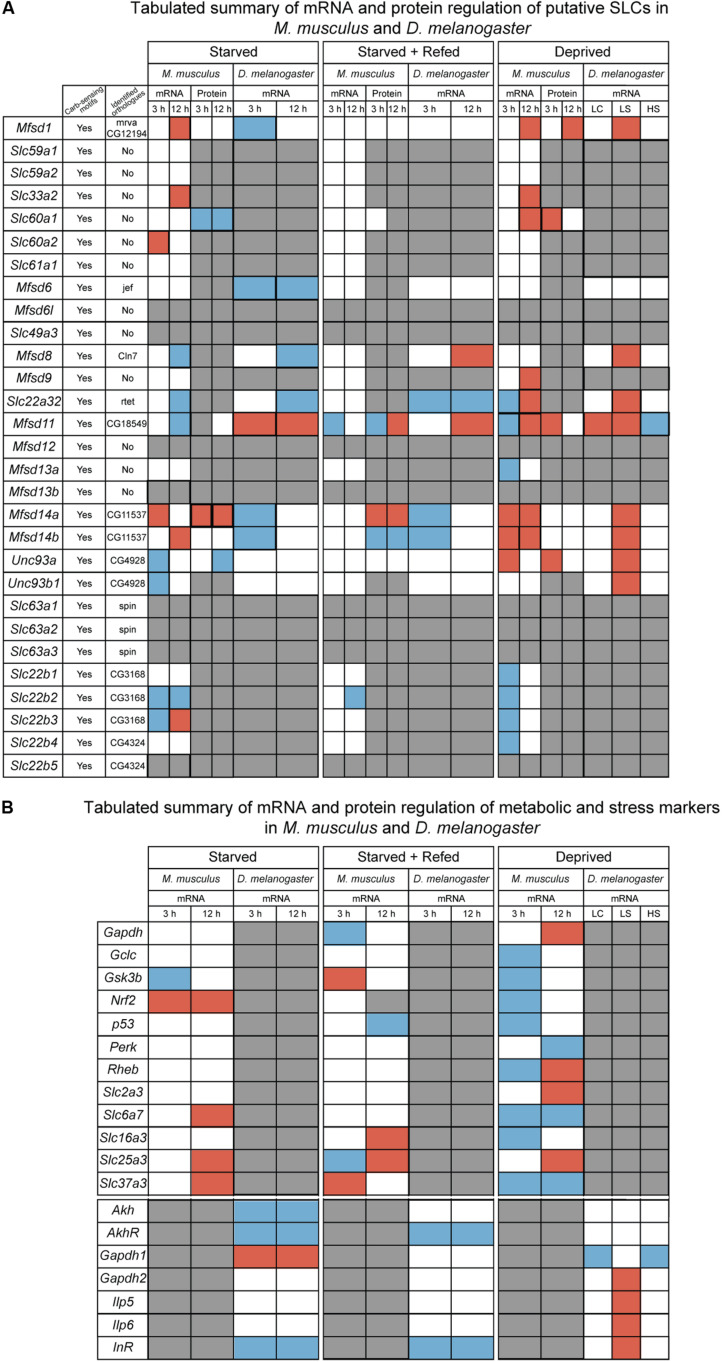
FIGURE 11.
Summarizing of the results from in vitro and in vivo experiments. (A) Tabulated summary of results regarding the putative SLCs obtained from mouse primary cortex cultures and fruit fly; displaying the presence of carbohydrate sensing motifs (Yes/No), identified orthologues and their name, gene and protein regulation for the three diets performed in primary cultures (starved, starved+refed, and deprived), gene regulation for fruit flies subjected to different diets [starved, starved+refed, low calorie (LC), low sugar (LS) and high sugar (HS)]. Red box indicate upregulation, blue box indicate downregulation, white box illustrates no regulation observed and gray box display where information is not obtained. (B) Tabulated summary of metabolic and stress targets in primary cortex cells and fruit flies. Red box indicate upregulation, blue box indicate downregulation, white box illustrates no regulation observed and gray box display where information is not obtained.

