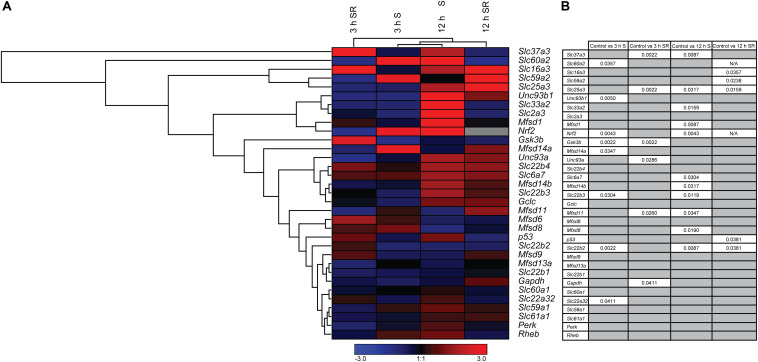
FIGURE 3.
The mRNA expression regulation of putative SLCs and genes connected to glucose metabolism and stress after glucose starvation as well as glucose starvation and refeeding. Primary cortex cells from mice were either subjected to glucose starvation (S) or glucose starvation and refeeding (SR) for 3 and 12 h. The mRNA expression was measured using qRT-PCR (n = 5 or 6 per group) and the expression was normalized against five stable housekeeping genes. The control for each group was set to 1 and the mRNA expression for each group is relative to its control. GraphPad Prism version 5 was used to calculate differences in mRNA expression using Mann–Whitney (* > 0.05, ** > 0.01, *** > 0.001). The heatmap was generated using GENESIS version 1.7.6 using the differences in fold change between the experimental groups and controls; red = upregulation, blue = downregulation and gray = data missing. (A) The heatmap display the alteration in gene expression for 3 h S, 12 h S, 3 h SR and 12 h SR compared with its corresponding control in the primary cortex cells. The genes and experiments were hierarchical clustered. (B) The table summarize the p-values. For starved and refed samples of Slc60a2 and Nrf2, not enough replicates were successfully analyzed to perform statistics, indicated by “N/A” in the table.

