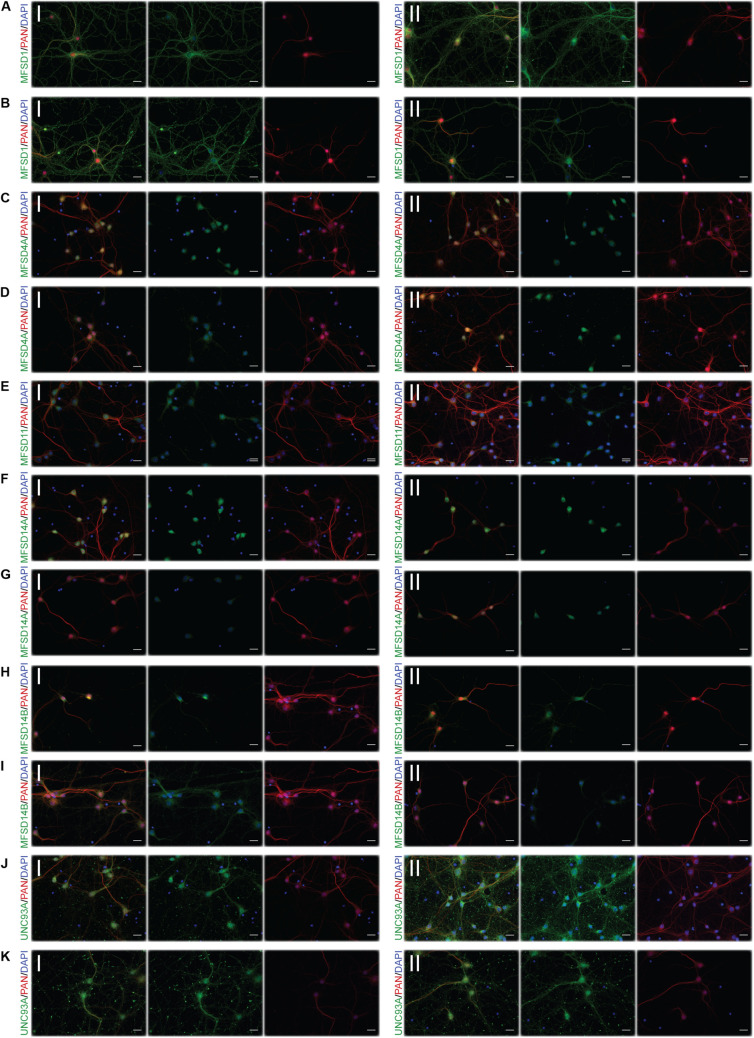
FIGURE 5.
Representative ICC images of the putative SLCs subjected to glucose starvation used for measuring changes in protein expression. Primary cortex cultures subjected to glucose starvation (S) for 3 and 12 h were used for immunocytochemistry. In total, six putative SLCs, where one antibody has been verified previously and shown to stain primary cortex cultures (Perland et al., 2016, 2017a,b,c; Ceder et al., 2017; Lekholm et al., 2017), were investigated; MFSD1, MFSD4A, MFSD11, MFSD14A, MFSD14B, and UNC93A. Images were taken using the same exposure settings for all pictures for each transporter, scale bar represents 20 μm. For each group, 6–10 pictures were taken including several cells. The putative SLC is labeled in green (FITC), the neuronal marker PAN in red (cyto) and the nucleus marker (DAPI) in blue. The panel consists of the representative ICC images of each target for both the (I) control and the (II) S condition; (A) MFSD1 3 h, (B) MFSD1 12 h, (C) MFSD4A 3 h, (D) MFSD4A 12 h, (E) MFSD11 12 h, (F) MFSD14A 3 h, (G) MFSD14A 12 h, (H) MFSD14B 3 h, (I) MFSD14B 12 h, (J) UNC93A 3 h, and (K) UNC93A 12 h.

