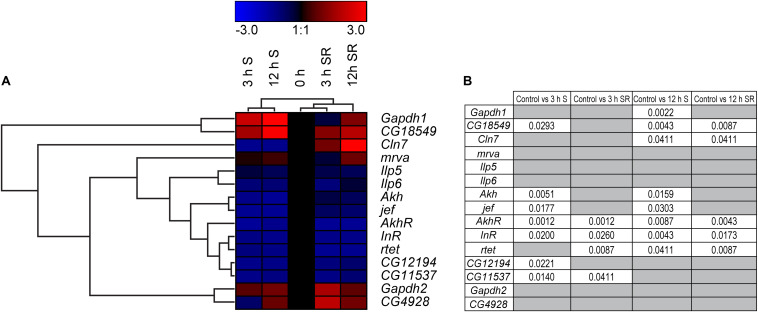
FIGURE 7.
Gene regulation of putative SLCs and genes involved in metabolism in D. melanogaster. Four groups of adult male flies, aged 5 days, were subjected to starvation for 0 h (control), 3 and 12 h, two of the groups (n = 6–8, with 10 flies in each) were euthanized immediately after starvation, while two groups (n = 8, with 10 flies in each) were refeed with Jazz Mix Standard food for 12 h before euthanized. Samples were used to measure the mRNA expression via qRT-PCR and the expression was normalized against three stable housekeeping genes. The control was set to 1 and the mRNA expression for each group is relative to the control group (0 h of starvation). GraphPad Prism version 5 was used to calculate differences in mRNA expression using Kruskal–Wallis with Mann–Whitney as a post-hoc test with Bonferroni’s correction (*p < 0.0489, **p < 0.00995, ***p < 0.00099). The heatmap was generated using GENESIS version 1.7.6 using the differences in fold change between the experimental groups and the control; red = upregulation, blue = downregulation, black = no change. The genes and experiments were hierarchical clustered. (A) The heatmap display alterations in gene expression for 0 h S, 3 h S, 12 h S, 3 h SR and 12 h SR flies. (B) The table summarize the p-values.

