

Abstract
Aim
Report our results of biomarker discovery in formalin-fixed paraffin-embedded (FFPE) nasopharyngeal carcinoma (NPC) via proteomic analysis.
Background
Nasopharyngeal carcinoma (NPC) is a rare cancer in Western countries. Proteomic analysis have already been reported as a useful tool to provide biomarkers. Formalin-fixed paraffin-embedded (FFPE) samples, despite largely underused, can provide invaluable information for biomarker research via proteomic analysis.
Methods
FFPE samples of NPC were submitted to protein extraction followed by FASP-digestion and label-free quantitative mass spectrometry (MS). Patients’ received concurrent chemoradiation with or without adjuvant chemotherapy as per Intergroup 0099 trial. IMRT was delivered following the RTOG0615 specifications. Toxicity was scored using the CTCAE 4.03 tables. Survival was estimated using Kaplan–Meier curves. Log-rank was used to detect differences. KEGG ontology graphics were generated.
Results
28 FFPE samples from NPC patients were used. Patients were: 79% male, 97% Caucasians, 86% WHO type 3, 40% T1, 10% T2, 25% T3, and 25% T4. With a median follow up of 37 months, local control was 83 (T1, 100% T2, T3 and T4), overall survival was 84%, and six patients developed distant metastases. All five patients that died were due to metastatic disease. Tumor samples contained a median of 75% of tumor material. We found Epstein–Barr (EBV) and Herpes simplex (HSV) viruses’ related proteins significantly present in early-stage primary NPC (T1 and T2, p < 0.01). A pool of 10 proteins was statistically up-regulated in the metastatic group of patients (p < 0.01). Median survival from this M1 group was <1 year (p < 0.001).
Conclusions
FFPE samples yielded adequate material for MS analysis. We found EBV and HSV related proteins on early-stage NPC, and proteomic profiling associated with distant metastases, potential candidates of disease biomarkers. Validation is needed.
Keywords: Nasopharyngeal carcinoma, Biomarkers, Proteomic analysis, Metastases prediction
1. Backgound
Nasopharyngeal carcinoma (NPC) is a rare cancer in Western countries. Almost 80% of cases occur in Asia, and the remaining fraction is spread across all continents in non-endemic intermediate and low incidence areas. Its etiology is a complex balance between Epstein–Barr virus (EBV) infection, host susceptibility, and environmental factors. Indeed, the past two decades showed a remarkable change in outcomes given to the implementation of widely used concurrent chemoradiation with intensity-modulated radiotherapy (IMRT). Our series, as others, results demonstrate local control of 90% at five years.1, 2, 3 Despite its sensibility to radiation and chemotherapy, nearly half of the patients will die to distant metastases. Given its enigmatic geographic distribution, NPC is not present on the Cancer Genome Atlas, and investigators have actively researched biomarkers to predict behavior and metastases. Proteomics has been used in Asia for biomarker discovery for this purpose. We report our exploratory use of proteomic analysis in a non-endemic European cohort of patients.4, 5, 6, 7, 8, 9, 10
2. Aim
Our aim is to report our results of biomarker discovery in FFPE from NPC samples from a non-endemic cohort of patients using label-free quantitative mass spectrometry proteomic analysis.
3. Methods
3.1. Study description
After approval from the institutional board (UIC901), we conducted a single-center retrospective study. We retrieved clinical, image and laboratorial data from 28 patients consecutive patients with biopsy-proven nasopharyngeal carcinoma (NPC) treated between February 2009 and December 2013. All patients were staged accordingly to AJCC/UICC 7th Edition. We performed a pathological review according to WHO classification for this study.
Patients were treated with cisplatin-based chemoradiation as per Intergroup 0099 trial.11 IMRT volumes were contoured as per RTOG 0615.12 A study diagram can be seen in Fig. 1.
Fig. 1.
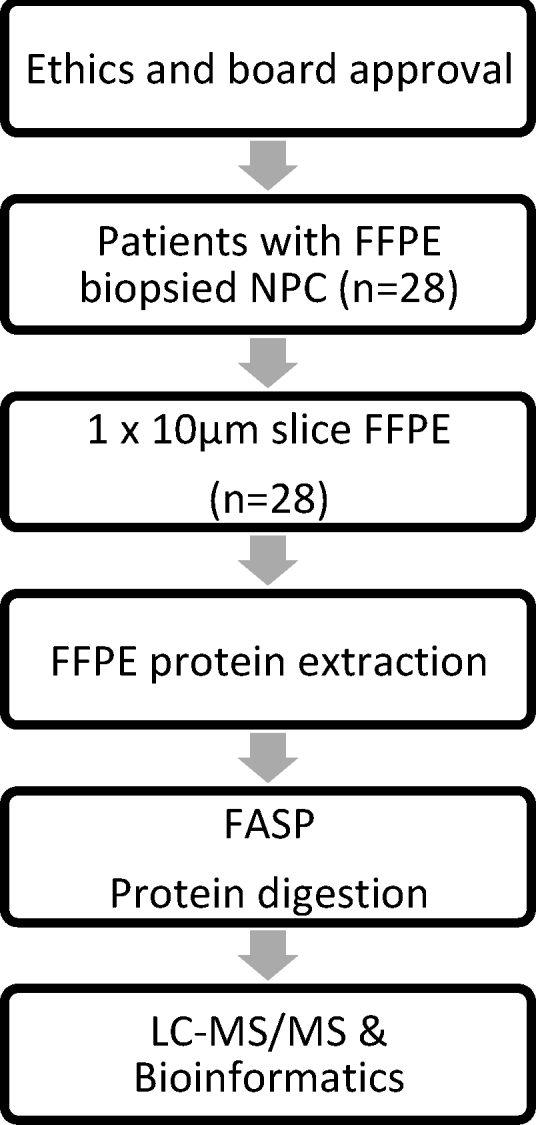
Study workflow (FFPE: formalin-fixed paraffin embedded; NPC: nasopharyngeal carcinoma; FASP: filter aided sample preparation; LC-MS/MS: liquid chromatography mass spectrometry).
3.2. Protein extraction, quantification and FASP digestion
Formalin-fixed paraffin-embedded (FFPE) NPC samples were deparaffinized using standard procedures as described by Araújo et al. and Donnarumma et al. with minor modifications. Briefly, FFPE slices were deparaffinized three times with xylol for 5 min in a dry bath at 63 °C. Then the tissue material was rehydrated with starting with 100% ethanol for 10 min with gentle shaking followed by incubation with 96%, 80%, 70%, and 50%. Samples were centrifuged at 2000 rpm for 10 min and the supernatant was discarded and replaced with fresh Milli-Q water, followed by a final centrifugation step at 3000 rpm for 10 min. Finally tissue sample were washed with Milli-Q water.
Protein extraction was carried out as described by Araújo et al. with minor modifications.13 Tissue samples were solubilized in 200 μL Tris–HCl 20 mM pH 9.0 containing 4% SDS and 0.1 M DTT. Samples were incubated at 100 °C for 20 min followed by ultrasonication using an ultrasonic probe (1 min, 2 mm tip, 100% ultrasonic amplitude). For protein quantification aliquots of protein extract were diluted 1:5 and 1:10 before measuring protein absorbance at 280 nm using a nanodrop. Protein digestion was performed using filter aided sample preparation (FASP) method as described by Donnarumma et al. (Fig. 2). Finally, samples were interrogated by mass spectrometry using label-free protein quantification LC-MS/MS methodology.14
Fig. 2.

Schematic representation workflow of FASP protein digestion of FFPE extracted proteins.
LC-MS/MS data were analyzed using Data Analysis 4.2 software (Bruker). Proteins were identified using Mascot (Matrix Science, UK). MS/MS spectra were searched against the SwissProt database S_Prot Human (73,045,382 sequences; 24,698,382 residues. Tandem MS data were searched with MASCOT search engine with the following parameters: precursor mass tolerance of 20 ppm, fragment tolerance of 0.05 Da, trypsin specificity with a maximum of 2 missed cleavages, cysteine carbamidomethylation set as fixed modification and methionine oxidation, as variable modification. False discovery rate (FDR) was estimated by running the searches against a randomized decoy database. Results of the identification step were filtered to proteins with a FDR below 1%.
Label-free quantification was carried out using MaxQuant software V1.6.0.16. All raw files were processed in a single run with default parameters.15 Database searches are performed using the Andromeda search engine with the UniProt-SwissProt Human Uniprot Proteome database as a reference and a contaminants database of common contaminants. Data processing was performed using Perseus (version 1.5.0.31).16 In brief, protein group LFQ intensities were log 2-transformed to reduce the effect of outliers. To overcome the obstacle of missing LFQ values, missing values were imputed before fitting the models. Log ratios were calculated as the difference in average log2 LFQ intensity values between the two digestion methods tested (two-tailed, Student's t test). A protein was considered statistically significant if its fold-change was ≥1.5 and FDR ≤ 0.01.17
3.3. Functional annotation using cytoscape
Integrative analysis with Cytoscape was based in the use of ClueGO plug-in. This plug-in strongly improves biological interpretation, once integrates Gene Ontology (GO) terms and KEGG pathways, creating a functionally organized GO/pathway term network.18
Complete case datasets were used in the analysis. No imputation methods were used. Survival was estimated with Kaplan–Meier survival analysis and log-rank test to detect differences (SPSS v.23, IBM). For statistical analysis, the day of first treatment was used. Outcome data was calculated as per April 6th, 2018.
3.4. Treatment Information and follow up
Intensity-modulated radiotherapy (IMRT) was delivered as per RTOG 0615, with a simultaneous-integrated boost of 69.96 Gy in 33 daily fractions to the primary and nodal GTVs, 59.4 Gy to the areas at risk and involved neck levels and 54 Gy to the uninvolved lower neck.12 Between 2009 and 2012, all treatments were delivered via 5–7 fields arrangement of sliding window IMRT. After 2012, VMAT was also an option depending on dose constraints compliance. Organs at risk were spared by RTOG 0615 recommendations until 2010. After that, QUANTEC tables were added whenever applicable. A 5-mm PTV margin was used until 2011, and 4 mm thereafter since we performed a quantitative study of margins already documented.22 Concurrent and adjuvant platinum-based chemotherapy was delivered according to the Intergroup 0099 trial fashion. Induction chemotherapy was performed for M1 patients and definitive radiation or chemoradiation was added 3–6 cycles depending on response. Post treatment neck dissection was performed in the presence of worrisome clinical or imaging features. Patients were followed every 3 months with consults and routine blood tests including thyroid function, with ENT, Medical Oncology and Radiation Oncology for the first 2 years with endoscopy and MRI or CT image. Similar follow up was continued every 6 months until 5 years, and yearly thereafter. Toxicity was scored using CTCAE v. 4.03 whenever possible. Audiogram was not available for our patients, so ototoxicity was scored following CTCAE recommendations for non-enrolling patients in audio monitoring.
4. Results
Patients and tumor characteristics can be found in Table 1. With a median follow up of 37 months, the overall local control is 83% for the whole cohort (90% for T1, 100% for T2, 57% for T3 and 86% for T4), overall survival is 84%, and six patients developed distant metastases. All five patients that died were due to metastatic disease.
Table 1.
Patients and tumor characteristics at diagnosis.
| Variable | N (%) | |
|---|---|---|
| Age, years | Median (range) | 47 (31–74) |
| Gender | Male | 22 (79%) |
| Female | 06 (21%) | |
| Histological WHO Grade | 1 | 03 (10%) |
| 2 | 01 (04%) | |
| 3 | 24 (86%) | |
| Clinical T Stage | T1 | 11 (40%) |
| T2 | 03 (10%) | |
| T3 | 07 (25%) | |
| T4 | 07 (25%) | |
| Clinical N Stage | N0 | 04 (14%) |
| N1 | 03 (11%) | |
| N2 | 13 (46%) | |
| N3 | 08 (29%) | |
| Clinical M Stage | M0 | 26 (93%) |
| M1 | 2 (07%) | |
| Stage (7th Edition) | II | 02 (07%) |
| III | 11 (40%) | |
| IVA | 06 (21%) | |
| IVB | 07 (25%) | |
| IVC | 02 (07%) | |
| ECOG performance status | 0 | 24 (86%) |
| 1 | 04 (14%) | |
| Ethnic Group | Caucasian | 27 (97%) |
| Asian | 01 (03%) | |
| Smoking habbits | No | 14 (50%) |
| ≤10 pack-year-units | 03 (10%) | |
| >10 pack-year-units | 11 (40%) | |
| Treatment | RT | 01 (04%) |
| CCRT | 03 (10%) | |
| CCRT + CT | 24 (86%) | |
| Overall treatment time | <49 days | 26 (93%) |
| >49 days | 02 (07%) | |
| EBV serum pre treatment | Undetected (<600) | 05 (18%) |
| Detected (≥600) | 07 (25%) | |
| Missing | 16 (57%) |
Local control was not affected by T-stage (Fig. 3A), even dichotomizing T1 + T2 vs. T3 + T4 (Fig. 3B) or comparing all T-stages vs. T4 (Fig. 3C). In our cohort, neither local control nor overall survival was affected by N-stage (Fig. 3D and E). The presence of distant metastasis was the most important prognostic factor.
Fig. 3.

Outcomes: (A) local control by T-stage (p = 0.623); (B) local control stratifying T1 + T2 vs T3 + T4 (p = 0.297); (C) local control stratifying all T stages vs T4 (p = 0.983); (D) regional control by N stage comparison: N0 vs N+ (p = 0.454); E) overall survival by N-status (N0 vs N + ve, p = 0.392); and F) overall survival by M stage (M0 vs M1, p = 0.001).
Tumor samples contained a median of 75% of tumor material (70–90%).
Patient's outcomes are available in Fig. 3A–F.
A tumor profiling with up-regulated (n = 59) and down-regulated (n = 12) proteins was identified in early T-stage (combining T1 and T2) compared to advanced T-stage tumors (combining T3 and T4). See Fig. 4, Fig. 5 and Annex 1. Gene ontology and KEGG pathway were generated for T1 + T2 tumors (Fig. 4), T3 + T4 tumors (Fig. 6, Fig. 7). On both groups, different on protein expression were statistically significant p < 0.01).
Fig. 4.

Volcano plot of label-free quantitative proteomic results comparing early-stage NPC tumors (T1 and T2 grouped versus T3 and T4).
Fig. 5.

Gene ontology and KEGG pathway enrichment significant present on early-stage NPC tumors (T1 and T2 patients versus T3 and T4 tumors, p < 0.01). Arrows point to Epstein–Barr virus and Herpes simplex infection proteins identified on the Antigen processing and presentation pathway.
Fig. 6.

Gene ontology and KEGG pathway enrichment significant present on advanced-stage NPC tumors (T3 and T4 patients versus T1 and T2 tumors, p < 0.01).
Fig. 7.

Gene ontology and KEGG pathway enrichment significant present on advanced-stage NPC tumors (T3 and T4 patients versus T1 and T2 tumors, p < 0.01).
A pool of 10 proteins was statistically up-regulated in M1 patients: tumor protein D52, tumor protein 63, serine/threonine-protein kinase MRCK alpha, tyrosine-protein kinase HCK, EGFR-kinase substrate 8-like protein 2, caspase-1, heat shock-related 70 kDa protein 2, interferon regulatory factor 6, interferon-induced protein with tetratricopeptide repeats 2 and Interferon-induced protein with tetratricopeptide repeats 3. Median survival from this M1 group was less than one year (p < 0.001; Fig. 8).
Fig. 8.

Gene ontology and KEGG pathway enrichment significant present on M1-NPC patients (M1 vs M0 patients, p < 0.001). Graphic shows a pool of 10 proteins up-regulated on M1 patients.
5. Discussion
FFPE tissues hold invaluable information regarding patients’ outcomes. Nevertheless, its features pose challenging tasks to scientists all over the world. Few series have studied NPC via FFPE samples.9, 19
Our data showed a pool of up (n = 59) and down-regulated (n = 12) proteins in early T-Stage (T1 and T2) compared to advanced local disease (T3 and T4). All were statistically altered. Despite that, survival curves for local control were identical for any T-stage (p = 0.623) even dichotomizing between T1 + T2 vs. T3 + T4 (p = 0.297) or comparing all T-stages vs. T4 (p = 0.983) (Fig. 3A–C).
This can be explained by the excellent local control and survival yielded by chemoradiation for all T or N stages (p = 0.454). Nevertheless, future mature data could increase the power to detect differences. These rates are in agreement with others in Eastern and Western countries.1, 20, 21, 22, 23, 24 It is unclear rather this signature means that an early T-stage could receive a different protocol prescription (i.e., de-intensified strategies or doses). At this subgroup, bioinformatics KEGG pathway showed that the most significant difference in proteins were in the up-regulation of antigen processing and presentation and also protein targeting ER (Fig. 5).
As expected in this entity, viral proteins were markedly present on early stage tumors group of patients (T1 + T2), especially EBV, ubiquitous in NPC regardless of geographic distribution. The proteins detected and its interplay effect are highly correlated to EBV infection (Table 2). It has already been described that EBV proteins may also trigger miRNAs able to cause pleiotropic effects on cells. It has been described that LMP1 can activate mir-146a, which can down-regulate genes related to interferon responsiveness25. The absence of EBV related proteins in the advanced-stage tumors (T3 + T4) proteins group must be interpreted with caution since it can be explained by the method's limitation in detecting proteins with low proportions’ concentration. Whether this absence can represent a different disease stage, it remains to be better understood.
Table 2.
Functioning pathway of detected proteins via bioinformatics.
| Variables | Function pathway |
|---|---|
| T1 + T2 (vs T3 + T4, p < 0.01) | Antigen processing and presentation |
| Protein targeting to ER | |
| T3 + T4 (vs T1 + T2, p < 0.01) | Regulation of mRNA stability |
| mRNA metabolic process | |
| Exocitosis | |
| DNA replication | |
| Nucleoside triphosphate metabolic process | |
| M1 (vs M0, p < 0.01) | Type I interferon signaling pathway |
| Actin cytoskeleton reorganization | |
| Protein tetramerization | |
| Termination of RNA polymerase II transcription | |
| NADH metabolic process |
However, not only EBV proteins were present, but also Herpes simplex virus. Whether these signs of co-infection can be interpreted as a cofounding factor or a relevant issue for early-stage in our cohort remains unclear. Nevertheless, in all KEGG pathways run, we have not found any HPV related proteins, a known marker for poor prognosis among Caucasians.26
On the other hand, a significant pool of 10 proteins were up-regulated in M1 patients (p < 0.01). This is important information since M1 disease is the most important factor affecting survival for any stage (p < 0.001). See Annex 2. At this M1 subgroup, KEGG ontology pathway via bioinformatics showed functioning activity by type I interferon signaling pathway, actin cytoskeleton reorganization, protein tetramerization, termination of RNA polymerase II transcription and NADH metabolic process (Fig. 8). These preliminary results were able to identify signatures containing known proteins related to head and neck cancer onset and behavior, not only NPC, and potential therapeutical targets (like interferon and EGFR). If these results remain consistent, it generates hypothesis whether tyrosine kinase or interferon should be investigated in clinical trials. For example, adjuvant interferon has yielded superb results in children and young adults with NPC (German GPOH Study NPC91).27
Asian authors have already published data with the use of FFPE tissue for biomarker discovery or validation (Table 3). Despite different methods used, it was possible to detect different effects on outcome. Chan et al. and Chen et al. identified biomarkers related to metastasis promotion.28, 29 Xiao et al.9 have reported four biomarkers related to NPC types (cathepsin D, keratin 8, SFN, and stathmin 1). The report of Chen et al., using FFPE as validation for Cell line research, identified TRIM29 as a metastasis-promoter using 2D LC-MS/MS (Table 3).
Table 3.
Studies using FFPE with methods for biomarker discovery.
| Reference | Year | Author | Country | Biomarker | Material | N | Method | Effect |
|---|---|---|---|---|---|---|---|---|
| 6 | 2010 | Xiao, Z. | China | Cathepsin D Keratin8 SFN Stathmin1 |
FFPE | 40 | 2D liquid chromatography-tandem MS coupled with iTRAQ | Correlation of differential expression with the NPC types |
| 11 | 2016 | Chen, Z. | China | SQSTM1 RAN TRIM29 |
Cell line (FFPE for validation) | 108 | iTRAQ-tagging combined with 2D LC-MS/MS | TRIM29 as a metastasis-promoted protein |
| 19 | 2007 | Chan, C. | China | Annexin II Beta-2-tubulin | Cell-line, FFPE |
40 | 2DGE | Annexin II down-regulation positively associated with node metastasis |
| 20 | 2016 | Yuan, H | China | 14-3-3σ Maspin RKIP GRP78 |
FFPE | 149 | IHC | RKIP for radiosensitive, and GRP78 for radioresistance |
Recently, Xu et al. published novel biomarkers of NPC metastasis risk identified by reverse-phase protein array (RPPA) based tumor profiling with consideration of plasma EBV DNA load. Their study reported a pool of 26 proteins related to metastasis in a Chinese cohort of patients.30 Our report also presents findings compatible with outcome-related combination of proteins.
Our study has limitations. We acknowledge that there is a high number of missing data from EBV plasma load pre-treatment. And, we kept included two patients already M1 at diagnosis.
To our knowledge, this is the first report of proteomic analysis of NPC from a European cohort of patients. Validation essay is warranted.
6. Conclusion
In conclusion, FFPE is largely underused as a source of clinical information. Our protocol was able to safely extract and present biological material from FFPE samples yielding adequate material to MS analysis. These preliminary findings identified tumor signature profiles strongly associated with early and late T-stages, and also related to distant metastases in a non-endemic cohort of NPC patients. Though validation is needed, these data support further ongoing studies by our group.
Authors’ contribution
Conception and design: Eduardo Netto, Hugo Santos, José Capelo-Martínez.
Method Luís Carvalho, Hugo Santos, José Capelo-Martínez.
Provision of study materials or patients: All.
Pathology Review: Miguel Rito, José Cabeçadas.
Collection and assembly of data: All.
Data analysis and interpretation: Eduardo Netto, Hugo Santos, Luís Carvalho, Margarida Roldão.
Manuscript writing: All.
Final approval of manuscript: All.
Conflict of interest
None declared.
Financial disclosure
This work was supported by Instituto Português de Oncologia de Lisboa Francisco Gentil Research Fund (IPOLFG) [grant 2015/UIC901].
Acknowledgment
The authors would like to thank Fernanda Silva (PhD) for her technical contribution to this work.
Footnotes
Supplementary material related to this article can be found, in the online version, at https://doi.org/10.1016/j.rpor.2020.05.007.
Appendix A. Supplementary data
The following are Supplementary data to this article:
References
- 1.Lee N., Harris J., Garden A.S. Intensity-modulated radiation therapy with or without chemotherapy for nasopharyngeal carcinoma: radiation therapy oncology group phase II trial 0225. J Clin Oncol. 2009;27:3684–3690. doi: 10.1200/JCO.200819.9109. [DOI] [PMC free article] [PubMed] [Google Scholar]
- 2.Netto E., Ferreira M., Esteves S. EP-1176: long-term outcomes and toxicity profile of chemoradiation for nasopharyngeal carcinoma. Radiother Oncol. 2018;127:S658–S659. doi: 10.1016/S0167-8140(18)31486-5. [DOI] [Google Scholar]
- 3.Blanchard P., Lee A., Marguet S. Chemotherapy and radiotherapy in nasopharyngeal carcinoma: an update of the MAC-NPC meta-analysis. Lancet Oncol. 2015;16:645–655. doi: 10.1016/S1470-2045(15)70126-9. [DOI] [PubMed] [Google Scholar]
- 4.Ho J.H.C. An epidemiologic and clinical study of nasopharyngeal carcinoma. Int J Radiat Oncol. 1978;4:183–198. doi: 10.1016/0360-3016(78)90137-2. [DOI] [PubMed] [Google Scholar]
- 5.Chang E.T., Adami H.-O. The enigmatic epidemiology of nasopharyngeal carcinoma. Cancer Epidemiol Biomarkers Prev. 2006;15:1765–1777. doi: 10.1158/1055-9965.EPI-06-0353. [DOI] [PubMed] [Google Scholar]
- 6.Adham M., Kurniawan A.N., Muhtadi A.I. Nasopharyngeal carcinoma in Indonesia: epidemiology, incidence, signs, and symptoms at presentation. Chin J Cancer. 2012 doi: 10.5732/cjc.011.10328. [DOI] [PMC free article] [PubMed] [Google Scholar]
- 7.Yu M.C., Yuan J.M. Epidemiology of nasopharyngeal carcinoma. Semin Cancer Biol. 2002;12:421–429. doi: 10.1016/s1044579x02000858. [DOI] [PubMed] [Google Scholar]
- 8.Wang Y., Zhang Y., Ma S. Racial differences in nasopharyngeal carcinoma in the United States. Cancer Epidemiol. 2013;37:793–802. doi: 10.1016/j.canep.2013.08.008. [DOI] [PMC free article] [PubMed] [Google Scholar]
- 9.Xiao Z., Li G., Chen Y. Quantitative proteomic analysis of formalin-fixed and paraffin-embedded nasopharyngeal carcinoma using iTRAQ labeling, two-dimensional liquid chromatography, and tandem mass spectrometry. J Histochem Cytochem. 2010;58:517–527. doi: 10.1369/jhc.2010.955526. [DOI] [PMC free article] [PubMed] [Google Scholar]
- 10.Chen Y., Zheng, Chen Immunoassay for LMP1 in nasopharyngeal tissue based on surface-enhanced Raman scattering. Int J Nanomed. 2011:73. doi: 10.2147/IJN.S26854. [DOI] [PMC free article] [PubMed] [Google Scholar]
- 11.Al-Sarraf M., LeBlanc M., Giri P.G. Chemoradiotherapy versus radiotherapy in patients with advanced nasopharyngeal cancer: phase III randomized Intergroup study 0099. J Clin Oncol. 1998;16:1310–1317. doi: 10.1200/JCO.1998.16.4.1310. [DOI] [PubMed] [Google Scholar]
- 12.Lee N.Y., Zhang Q., Pfister D.G. Addition of bevacizumab to standard chemoradiation for locoregionally advanced nasopharyngeal carcinoma (RTOG 0615): a phase 2 multi-institutional trial. Lancet Oncol. 2012;13:172–180. doi: 10.1016/S1470-2045(11)70303-5. [DOI] [PMC free article] [PubMed] [Google Scholar]
- 13.Araújo J.E., Oliveira E., Otero-Glez A. A comprehensive factorial design study of variables affecting protein extraction from formalin-fixed kidney tissue samples. Talanta. 2014;119:90–97. doi: 10.1016/j.talanta.2013.10.019. [DOI] [PubMed] [Google Scholar]
- 14.Donnarumma F., Végvári Á., Rezeli M., Welinder C., Jansson B., Marko-Varga G. Accessing microenvironment compartments in formalin-fixed paraffin-embedded tissues by protein expression analysis. Bioanalysis. 2013;5:2647–2659. doi: 10.4155/bio.13.222. [DOI] [PubMed] [Google Scholar]
- 15.Tyanova S., Temu T., Carlson A., Sinitcyn P., Mann M., Cox J. Visualization of LC-MS/MS proteomics data in MaxQuant. Proteomics. 2015;15:1453–1456. doi: 10.1002/pmic.201400449. [DOI] [PMC free article] [PubMed] [Google Scholar]
- 16.Tyanova S., Temu T., Sinitcyn P. The Perseus computational platform for comprehensive analysis of (prote)omics data. Nat Methods. 2016;13:731–740. doi: 10.1038/nmeth.3901. [DOI] [PubMed] [Google Scholar]
- 17.Cox J., Mann M. MaxQuant enables high peptide identification rates, individualized p.p.b.-range mass accuracies and proteome-wide protein quantification. Nat Biotechnol. 2008;26:1367–1372. doi: 10.1038/nbt.1511. [DOI] [PubMed] [Google Scholar]
- 18.Bindea G., Mlecnik B., Hackl H. ClueGO: a Cytoscape plug-in to decipher functionally grouped gene ontology and pathway annotation networks. Bioinformatics. 2009;25:1091–1093. doi: 10.1093/bioinformatics/btp101. [DOI] [PMC free article] [PubMed] [Google Scholar]
- 19.Chen Z., Long L., Wang K. Identification of nasopharyngeal carcinoma metastasis-related biomarkers by iTRAQ combined with 2D-LC-MS/MS. Oncotarget. 2016;7:34022–34037. doi: 10.18632/oncotarget.9067. [DOI] [PMC free article] [PubMed] [Google Scholar]
- 20.Setton J., Han J., Kannarunimit D. Long-term patterns of relapse and survival following definitive intensity-modulated radiotherapy for non-endemic nasopharyngeal carcinoma. Oral Oncol. 2015 doi: 10.1016/j.oraloncology.2015.11.015. [DOI] [PMC free article] [PubMed] [Google Scholar]
- 21.Rotolo F., Pignon J.-P., Bourhis J. Surrogate end points for overall survival in loco-regionally advanced nasopharyngeal carcinoma: an individual patient data meta-analysis. Natl Cance Inst. 2017 doi: 10.1093/jnci/djw239. [DOI] [PMC free article] [PubMed] [Google Scholar]
- 22.Chan A.T.C., Gregoire V., Lefebvre J.-L. Nasopharyngeal cancer: EHNS-ESMO-ESTRO Clinical Practice Guidelines for diagnosis, treatment and follow-up. Ann Oncol. 2012;23:vii83–vii85. doi: 10.1093/annonc/mds266. [DOI] [PubMed] [Google Scholar]
- 23.Lee A.W.M., Ng W.T., Chan Y.H., Sze H., Chan C., Lam T.H. The battle against nasopharyngeal cancer. 2012;104:272–278. doi: 10.1016/j.radonc.2012.08.001. [DOI] [PubMed] [Google Scholar]
- 24.Kam M.K.M., Teo P.M.L., Chau R.M.C. Treatment of nasopharyngeal carcinoma with intensity-modulated radiotherapy: the Hong Kong experience. Int J Radiat Oncol Biol Phys. 2004;60:1440–1450. doi: 10.1016/j.ijrobp.2004.05.022. [DOI] [PubMed] [Google Scholar]
- 25.Lo A.K., To K.F., Lo K.W. Modulation of LMP1 protein expression by EBV-encoded microRNAs. Proc Natl Acad Sci U S A. 2007;104(41):16164–16169. doi: 10.1073/pnas.0702896104. [DOI] [PMC free article] [PubMed] [Google Scholar]
- 26.Stenmark M.H., McHugh J.B., Schipper M. Nonendemic HPV-positive nasopharyngeal carcinoma: association with poor prognosis. Int J Radiat Oncol Biol Phys. 2014;88:580–588. doi: 10.1016/j.ijrobp.2013.11.246. [DOI] [PMC free article] [PubMed] [Google Scholar]
- 27.Mertens R., Granzen B., Lassay L. Treatment of nasopharyngeal carcinoma in children and adolescents: definitive results of a multicenter study (NPC-91-GPOH) Cancer. 2005;104:1083–1089. doi: 10.1002/cncr.2125.8. [DOI] [PubMed] [Google Scholar]
- 28.Chan C.M.L., Wong S.C.C., Lam M.Y.Y. Proteomic comparison of nasopharyngeal cancer cell lines C666-1 and NP69 identifies down-regulation of annexin II and beta2-tubulin for nasopharyngeal carcinoma. Arch Pathol Lab Med. 2008;132:675–683. doi: 10.1043/1543-2165.2008.132[675:PCONCC]2.0.CO;2. [DOI] [PubMed] [Google Scholar]
- 29.Yuan L., Yi H.-M., Yi H. Reduced RKIP enhances nasopharyngeal carcinoma radioresistance by increasing ERK and AKT activity. Oncotarget. 2016;7:11463–11477. doi: 10.18632/oncotarget.7201. [DOI] [PMC free article] [PubMed] [Google Scholar]
- 30.Xu T., Su B., Huang P. Novel biomarkers of nasopharyngeal carcinoma metastasis risk identified by reverse phase protein array based tumor profiling with consideration of plasma Epstein-Barr virus DNA load. PROTEOMICS – Clin Appl. 2016:1600090. doi: 10.1002/prca.20160009.0. [DOI] [PubMed] [Google Scholar]
Associated Data
This section collects any data citations, data availability statements, or supplementary materials included in this article.