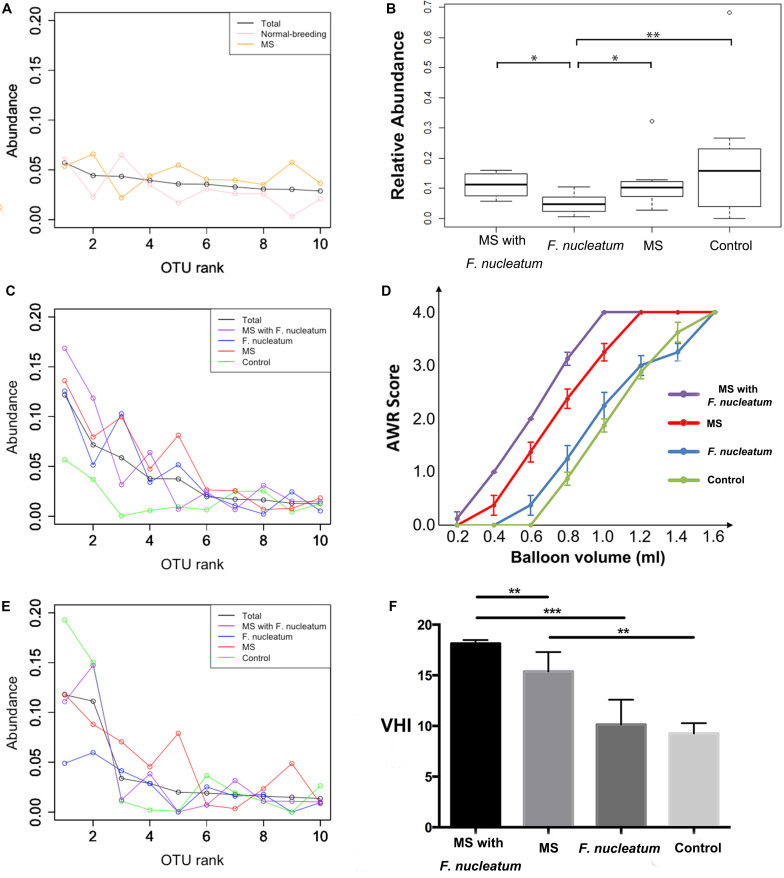
FIGURE 4.
Rank-abundance curve and visceral sensitivity evaluation. For rank-abundance curves, the OTU ranks at the X-axis were ordered by the mean abundance of total samples, and the curve of each group was referred to the same ranks of total samples. Curves were plotted at weeks 3 (A), 8 (B), and 12 (C). (D) The relative amount of the most abundant OTU at week 12. (E) Abdominal withdraw reflex (AWR) score. (F) Visceral hypersensitive index (VHI). *P < 0.05, **P < 0.01, ***P < 0.001. MS, maternal separation.

