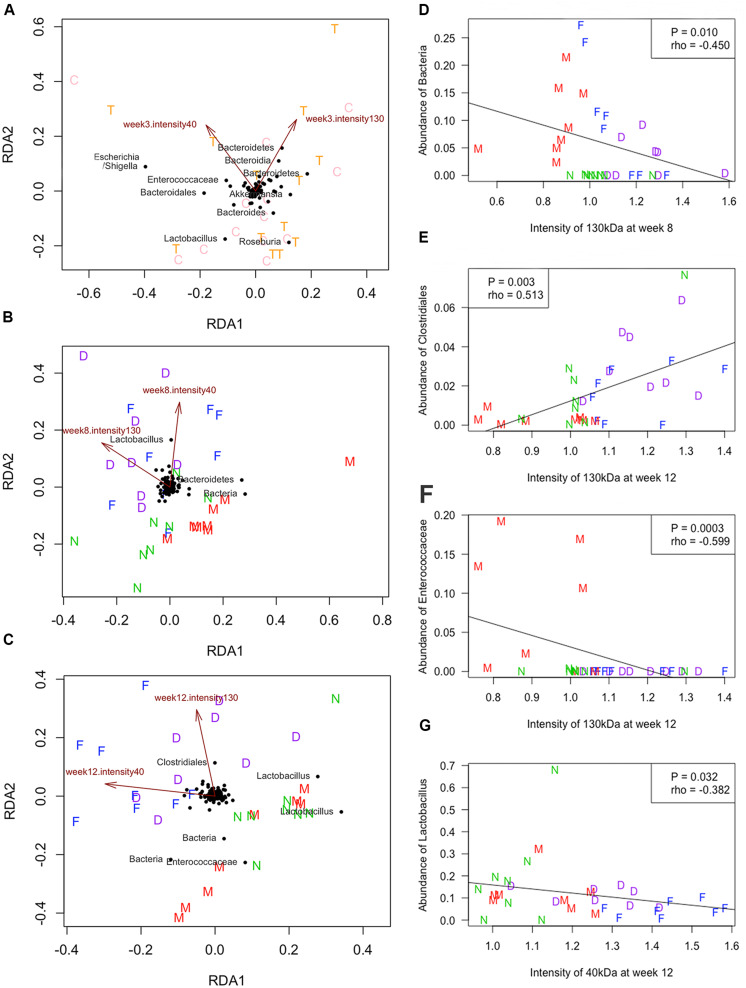
FIGURE 6.
Redundancy analysis (RDA) and Spearman correlation. The RDA was performed at weeks 3 (A), 8 (B), and 12 (C). The quantified proportional signals from reactive bands at 130 and 40 kDa were used as environmental variables. The Spearman correlation was calculated between the quantified proportional signals at 130 kDa and abundance of an unclassified OTU at week 8 (D), the signals of 130 kDa and abundance of the OTU belonged to Clostridiales (E) or Enterococcaceae (F) at week 12, and signals of 40 kDa and abundance of the OTU belonged to Lactobacillus at week 12 (G). C, normal-breeding rats; T, maternal separation (MS) rats; D, group MS with F. nucleatum; M, group MS; F, group F. nucleatum; N, control group.

