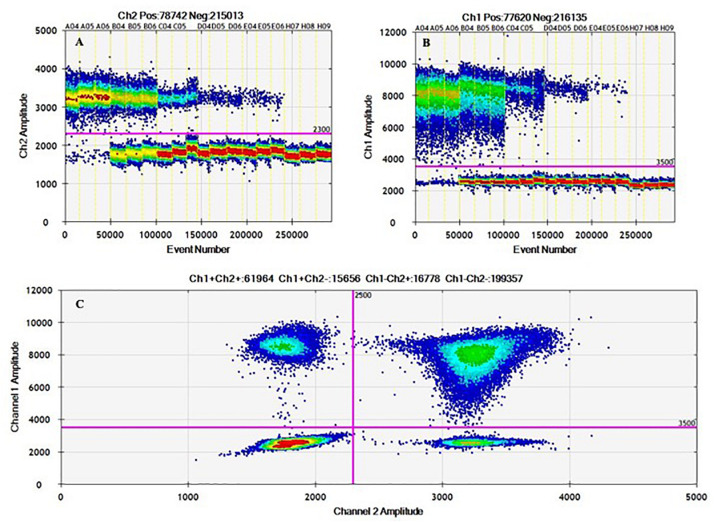
FIGURE 3.
1D and 2D ddPCR heat maps from working interval evaluation for duplex mode using hila – siiA targets. Evaluation of the working interval for hilA (A) and siiA (B) in the 1D plot (droplets vs. fluorescence amplitude), and 2D plot (channel one fluorescence (FAM) vs. channel two fluorescence (HEX) for each droplet; (C).

