Figure 1.
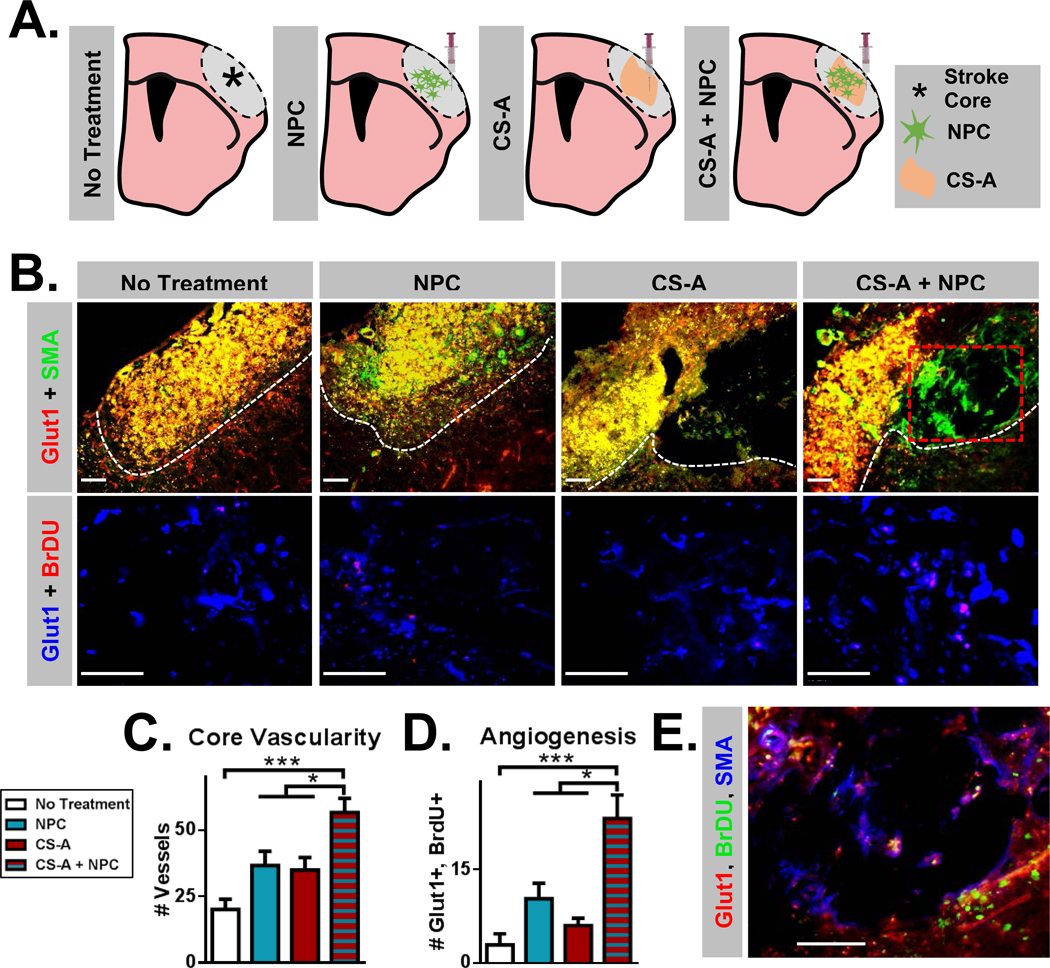
A. Schematic illustration of treatment groups following stroke in mice, including sham injection (no treatment), neural progenitor cell (NPC), chondroitin 4 sulfate A hydrogel (CS-A), and CS-A encapsulated NPC (CS-A + NPC) conditions. B. Top row: Fluorescent images of Glut1 and SMA staining showing vessels in the necrotic stroke core across treatments. White dotted line indicates stroke core region. Red dotted line indicates area visualized in part E. Bottom row: Fluorescent images of Glut1 and BrdU staining showing newly formed endothelial cells across treatments. C. Analysis of the vascularity (# Glut1+ vessels) within the stroke core region across treatments. D. Analysis of angiogenesis (Glut1/BrdU colabeled endothelium) across treatments. E. Representative fluorescent image of muscular artery formation (Glut1, SMA, BrdU) within the hydrogel in the CS-A + NPC treatment condition. Scale=50μm. n=8–12/group. *, **, and *** indicate p<0.05, p<0.005, and p<0.0005, respectively (1-way ANOVA, Tukey’s post-hoc).

