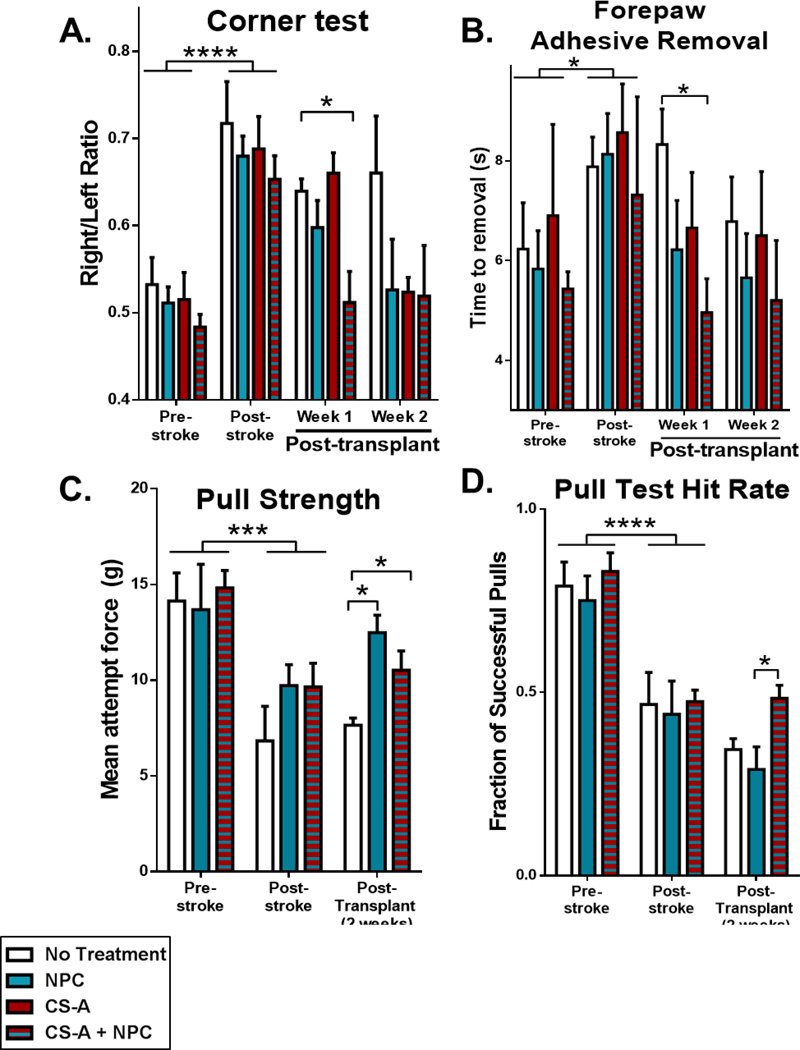
Figure 3.
A. Analysis of corner test. B. Analysis of forepaw adhesive removal test. n=8–12/group for corner tests and sticky dot. C. Analysis of pull strength. D. Analysis of hit rate in the pull test. n=3–4/group for pull tests. *, ***, and **** indicate p<0.05, p<0.0005, and p<0.0001, respectively (2-way ANOVA, Bonferroni’s multiple comparison test).

