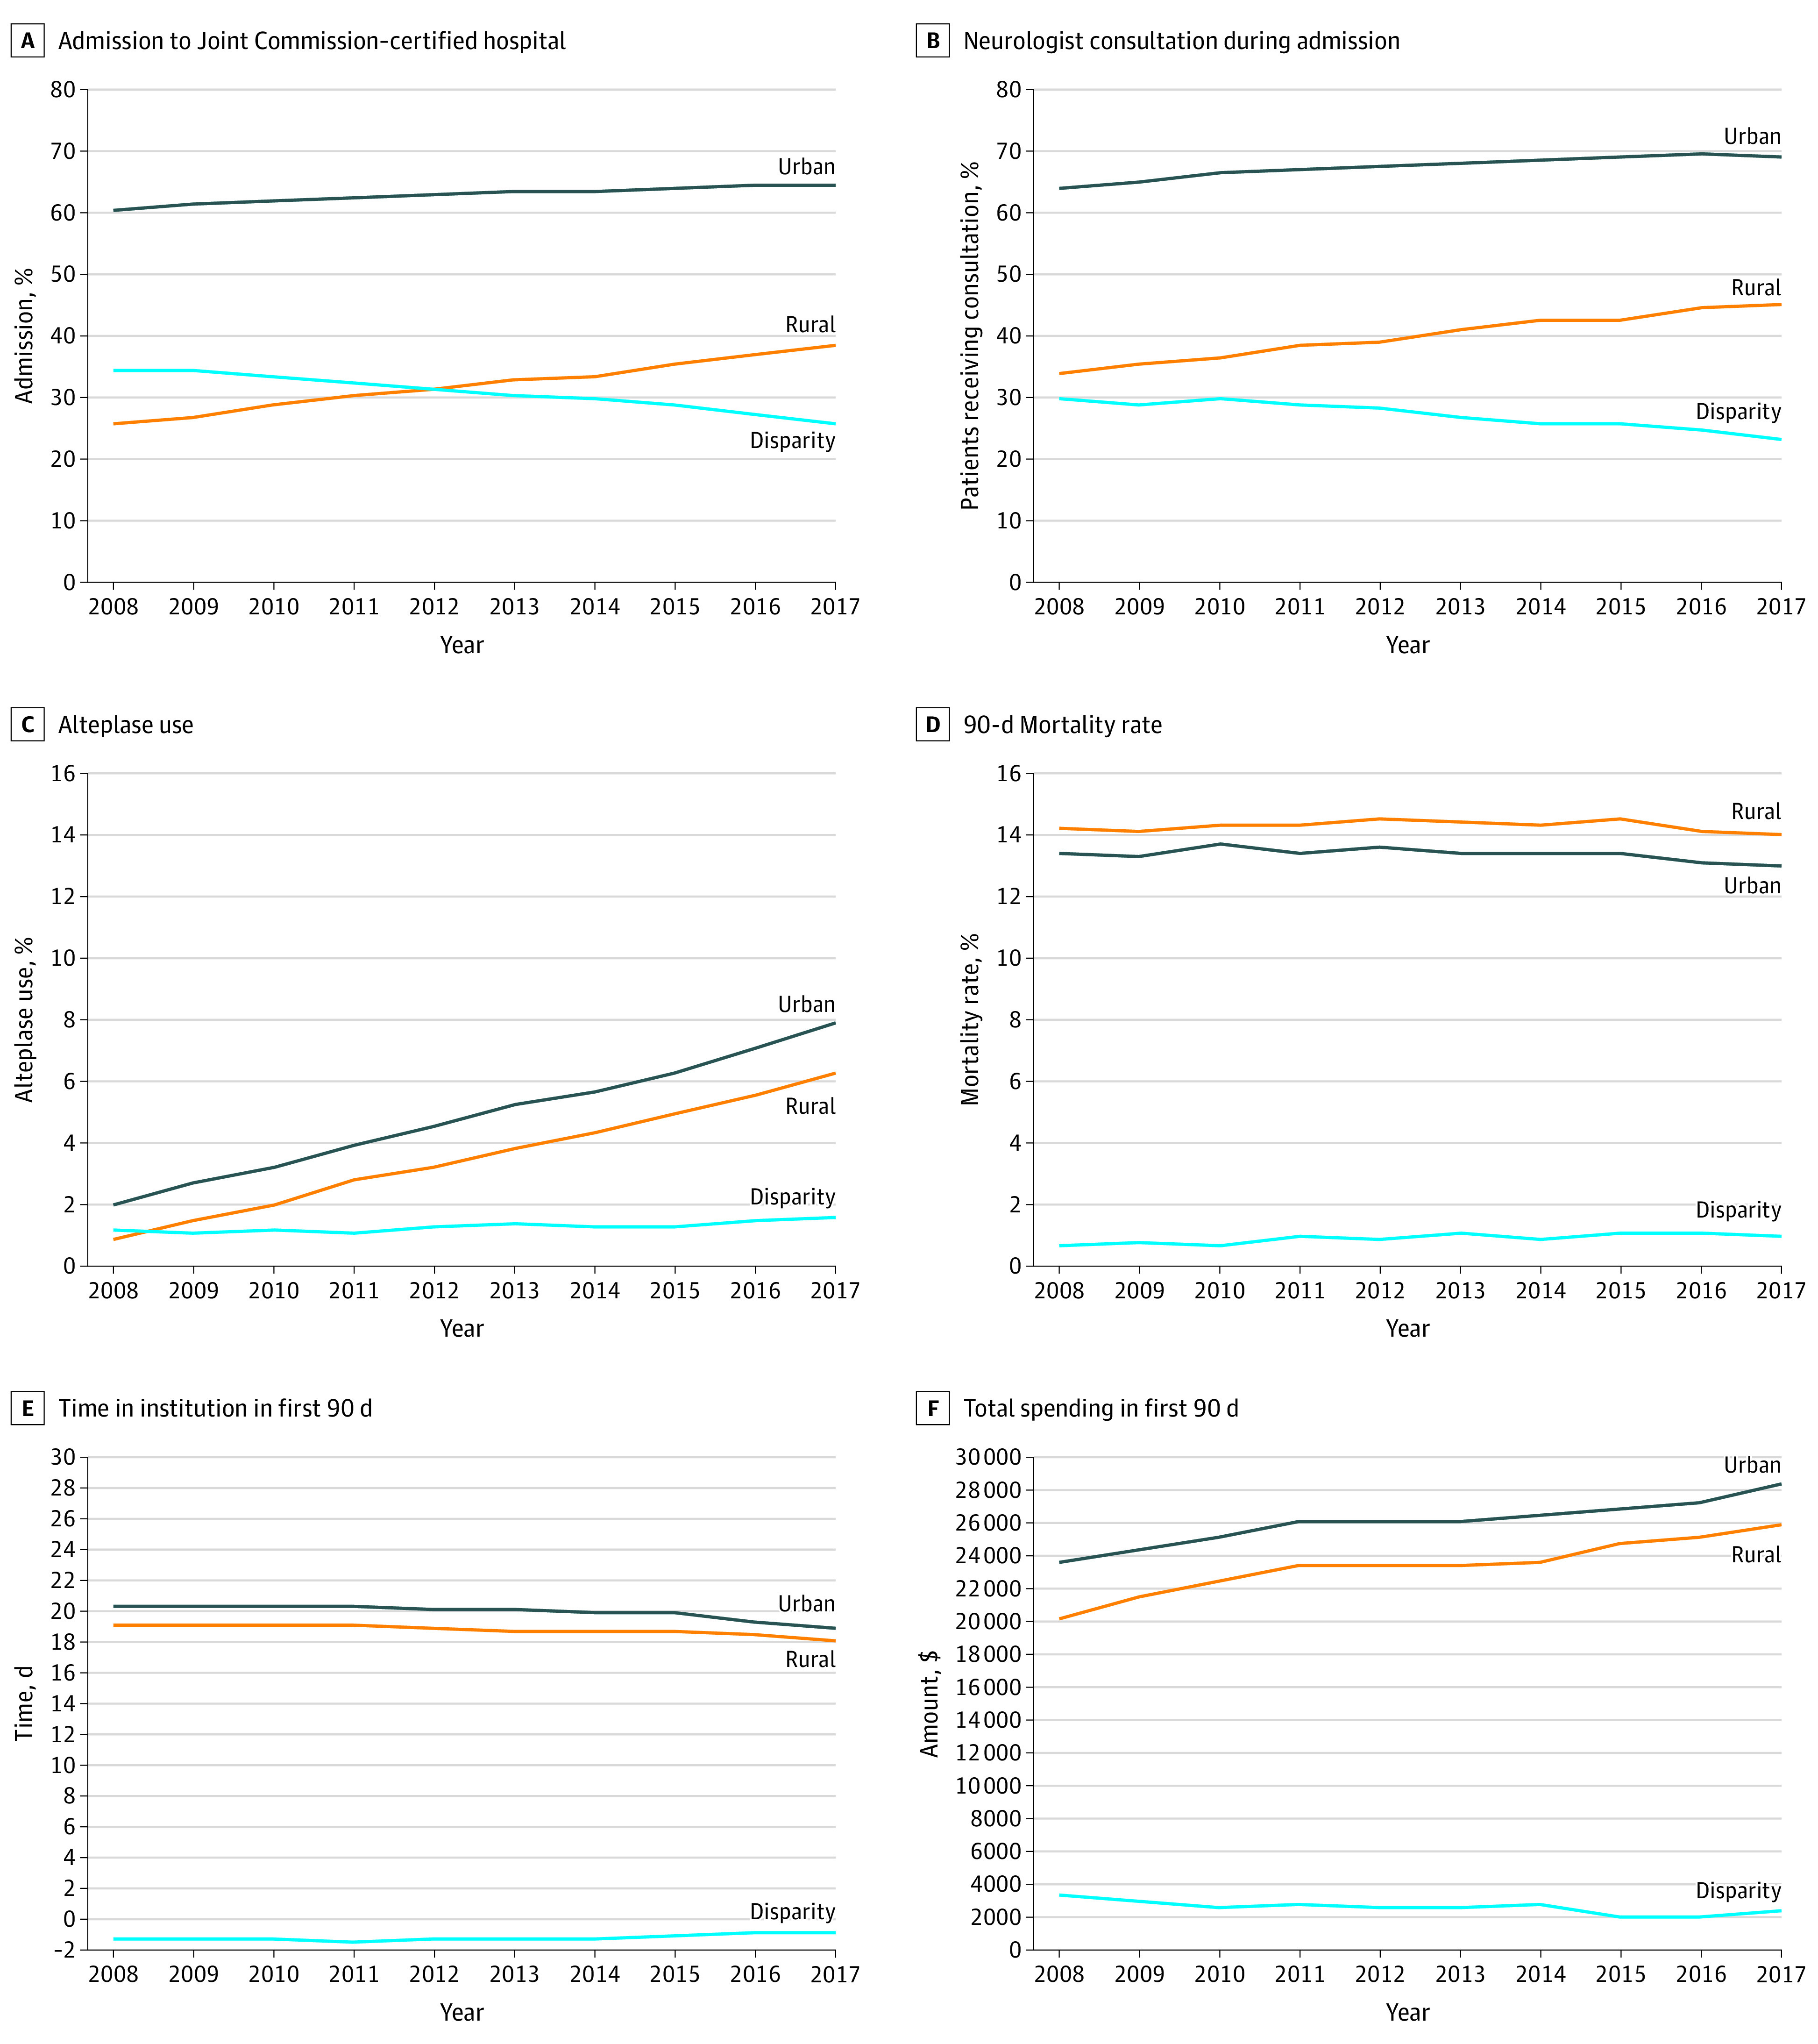
Figure. Trends in Acute Stroke and Transient Ischemic Attack Care for Rural and Urban Residents From 2008 Through 2017.

Adjusted rural and urban trends are shown for each outcome over the period 2008 through 2017. Trends were adjusted for patient age, sex, race/ethnicity, Medicaid enrollment in prior 12 months, original Medicare entitlement reason (whether for age, disability, or end-stage kidney disease), and 27 indicators for chronic conditions prior to admission. The disparity line for each outcome is the absolute differences between the adjusted trend lines. Downward sloping lines indicate a dissipating disparity, while upward sloping lines indicate a growing disparity. Flat lines indicate relatively little change in the level of a disparity over time.
