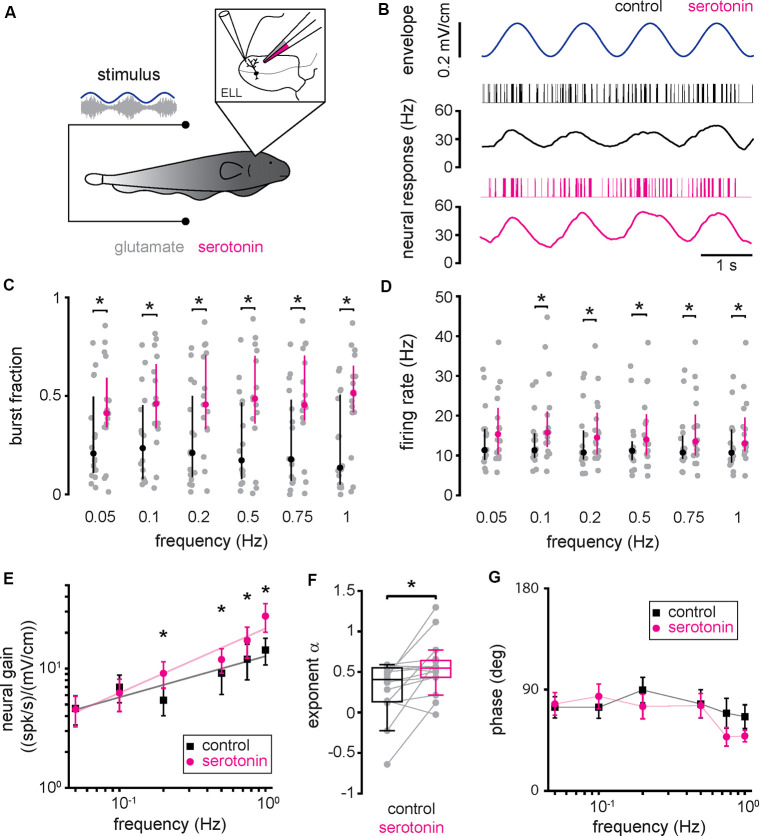
Figure 3.
Serotonin application increases pyramidal neuron responses to envelope stimuli through increased burst firing. (A) Schematic showing a pyramidal cell that is being recorded from extracellularly while a double-barrel pipette containing both glutamate as well as serotonin is located in the vicinity. (B) Spike train (black vertical bars) and firing rate (black trace) responses from a typical pyramidal cell to an envelope stimulus (blue, top) before serotonin application. Also shown are the spike train (magenta vertical bars) and firing rate (magenta trace) responses from this same pyramidal cell to the envelope stimulus (blue, top) after serotonin application. (C) Burst fraction before (black) and after (magenta) serotonin application for all envelope frequencies tested. (D) Firing-rate before (black) and after (magenta) serotonin application for all envelope frequencies tested. (E) Population averaged sensitivity (i.e., neural gain) between the envelope stimulus and the full spike train before (black) and after (magenta) serotonin application as a function of temporal frequency. (F) Best-fit power-law exponents before (left, black) and after (right, magenta) serotonin application to the neural gain as a function of temporal frequency curves shown in panel (E). (G) Population averaged phase between the envelope stimulus and the full spike train before (black) and after (magenta) serotonin application as a function of temporal frequency. Throughout, “*” indicates a statistically significant difference at the p = 0.05 level using either a Wilcoxon’s signed-rank test or a Student’s t-test.

