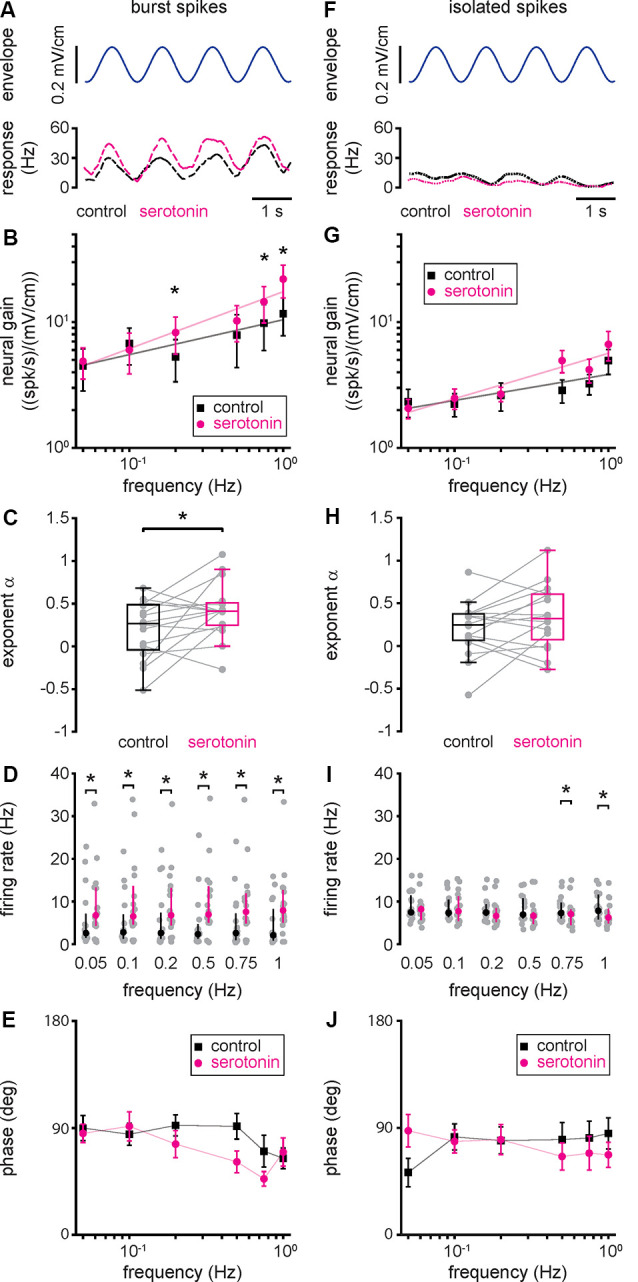
Figure 4.

Changes in neural responses to envelope stimuli due to serotonin application are due to changes in burst firing. (A) Envelope stimulus (top, blue) and the firing rate responses (bottom) of the burst (long-dashed) spike train before (black) and after (magenta) serotonin application. (B) Population averaged sensitivity (i.e., neural gain) between the envelope stimulus and the burst spike train before (black) and after (magenta) serotonin application as a function of temporal frequency. (C) Best-fit power-law exponents before (left, black) and after (right, magenta) serotonin application. (D) Firing-rate before (black) and after (magenta) serotonin application for all envelope frequencies tested when using the burst train. (E) Population averaged phase between the envelope stimulus and the burst spike train before (black) and after (magenta) serotonin application as a function of temporal frequency. (F) Same as (A), but for the isolated spike train (short-dashed). (G) Same as (B), but for the isolated spike train. (H) Same as (C), but for the isolated spike train. (I) Same as (D), but for the isolated spike train. (J) Same as (E), but for the isolated spike train. Throughout, “*” indicates a statistically significant difference at the p = 0.05 level using either a Wilcoxon’s signed-rank test or a Student’s t-test.
