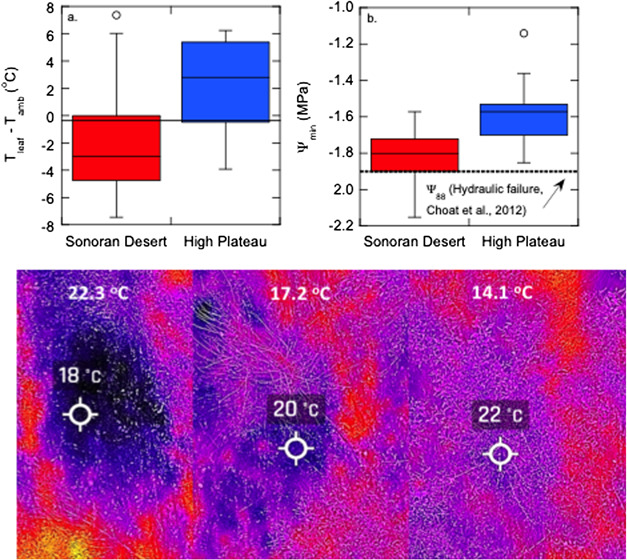
Figure 4. Contrasts in leaf temperature and leaf water potentials between high- and low-elevation Populus fremontii genotypes measured in the mid-elevation common garden (Figure 3). (a) Box and whisker plots showing the median, 25th and 75th percentiles (box plots) and 10th and 90th percentiles (error bars) of leaf surface temperatures (Tleaf) subtracted from ambient temperature (Tamb). (b) Box and whisker plots of minimum daily leaf water potentials (Ψmin) measured monthly over the growing season with a Scholander type pressure chamber. Lower panels represent canopy temperatures measured with a thermal camera on three genotypes sourced from three populations varying in mean annual temperatures (shown in white text).

