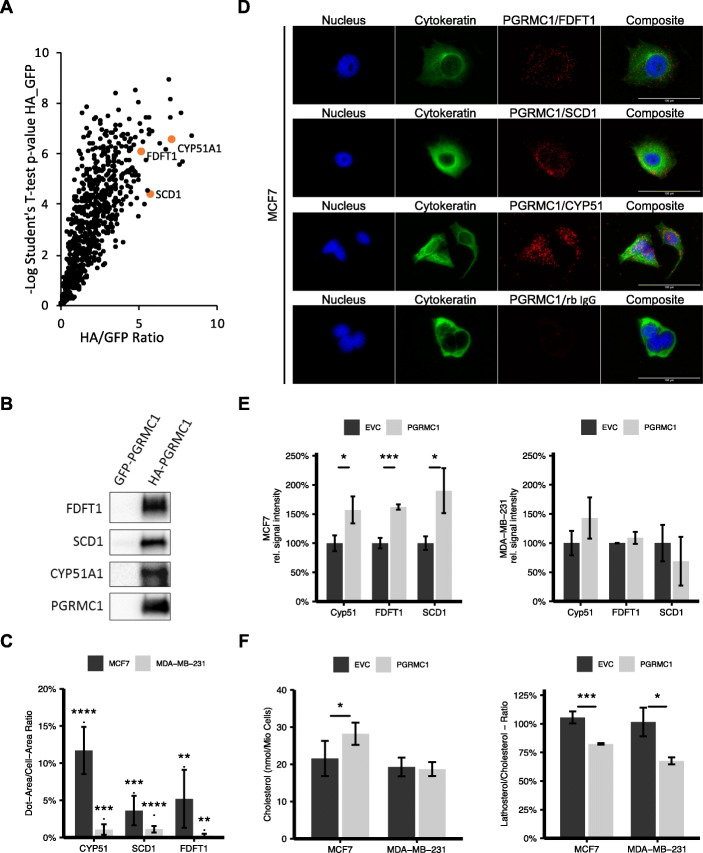
Fig. 2.
a Scatter plot of proteins with significantly higher intensities in PGRMC1-HA samples compared to PGRMC1-GFP samples identified by mass spectrometry. The most significant proteins exhibit very high value for Student’s t test difference HA_GFP and –log Student’s t test p value HA_GFP and are found in the upper right corner. Highlighted are proteins with important functions in steroid synthesis. b Detection of co-immunoprecipitated proteins CYP51A1, Stearoyl-CoA desaturase (SCD1), and FDFT1 by western blot. c Verification of the interactions via proximity ligation assay. Quantification of dots per cell. d Visualization via immunofluorescence microscopy. e Quantification of protein expression of CYP51, SCD1, and FDFT1 in MCF7/PGRMC1 cells and MDA-MB-231/PGRMC1 cells compared to their respective empty vector control by western blot. *p ≤ 0.05, ***p ≤ 0.001. f Detection of cholesterol and its precursor lathosterol in PGRMC1 overexpressing cells compared to the empty vector control cells with mass spectrometry *p ≤ 0.05, ***p ≤ 0.001 (Student’s t test, n = 3)

