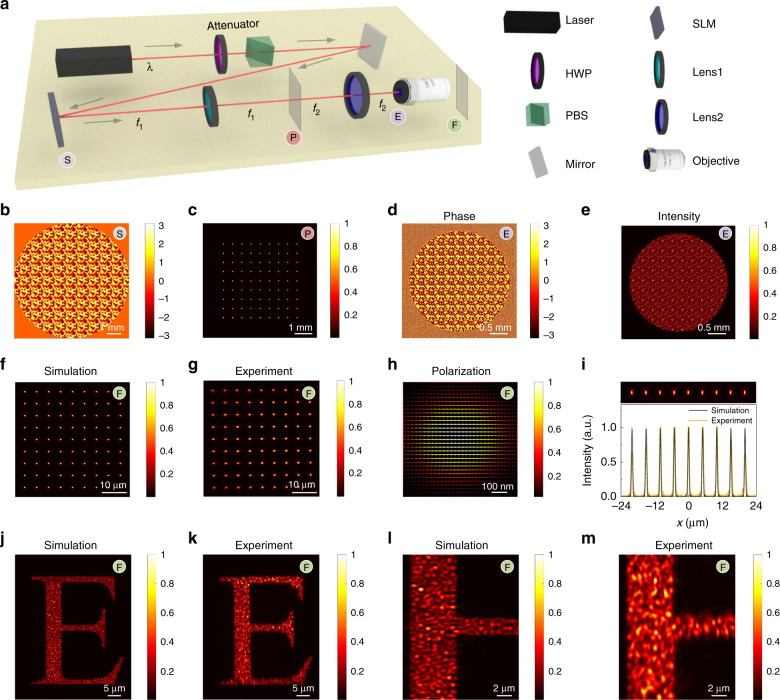
Fig. 5. Full-path calculation of a representative optical system.
a Sketch of the optical system. S: the plane on the panel of the SLM. P: the focal plane of Lens 1. E: the entrance pupil of the objective. F: the focal plane of the objective. (b) CGH displayed on the SLM for the generation of a 9 × 9 foci array. c The foci array on the focal plane of Lens 1 (P-plane). d Phase distribution and e intensity distribution on the entrance pupil of the objective (E-plane). f Simulated and g measured multi-foci array generated on the focal plane of the objective (F-plane). h Enlarged intensity profile of a single focal spot in the array. The arrows indicate the polarization directions. i Longitudinal intensity profile and corresponding line plot of the foci array. j Simulated and k measured intensity distribution on the F-plane when the CGH for the generation of the pattern “E” is encoded on the SLM. l, m Enlarged intensity profiles of the pattern corresponding to (j) and (k) with the same sampling points as in (i)

