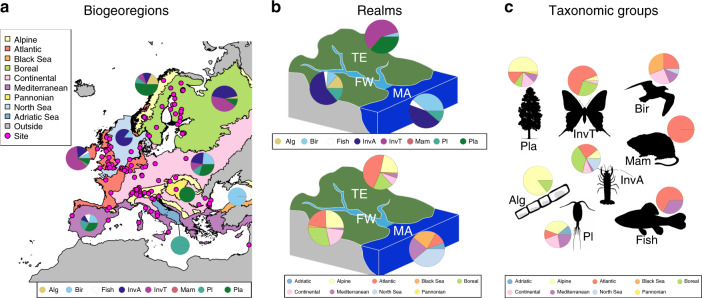
Fig. 1. Distribution of the time series across biogeoregions, realms and taxonomic groups.
a Relative distribution of studied taxonomic groups across biogeoregions (magenta dots: study sites). Note that the most south-eastern site (in Israel) belongs to the Mediterranean region. b Relative distribution of studied taxonomic groups and biogeoregions across realms. c Relative distribution of studied biogeoregions across taxonomic groups. FW freshwater, MA marine and transitional zone, TE terrestrial, Alg benthic algae, Bir birds, InvA aquatic invertebrates, InvT terrestrial invertebrates, Mam mammals, Pl plankton, Pla terrestrial plants. The pie charts show the proportion of taxonomic groups for each biogeoregion and realm, and the proportion of biogeoregions for each realm and taxonomic group. The shapefiles of the biogeographical regions and marine subregions were obtained from EEA74. Drawings of taxonomic groups are from phylopic.org. Source data are provided as a Source Data file.

