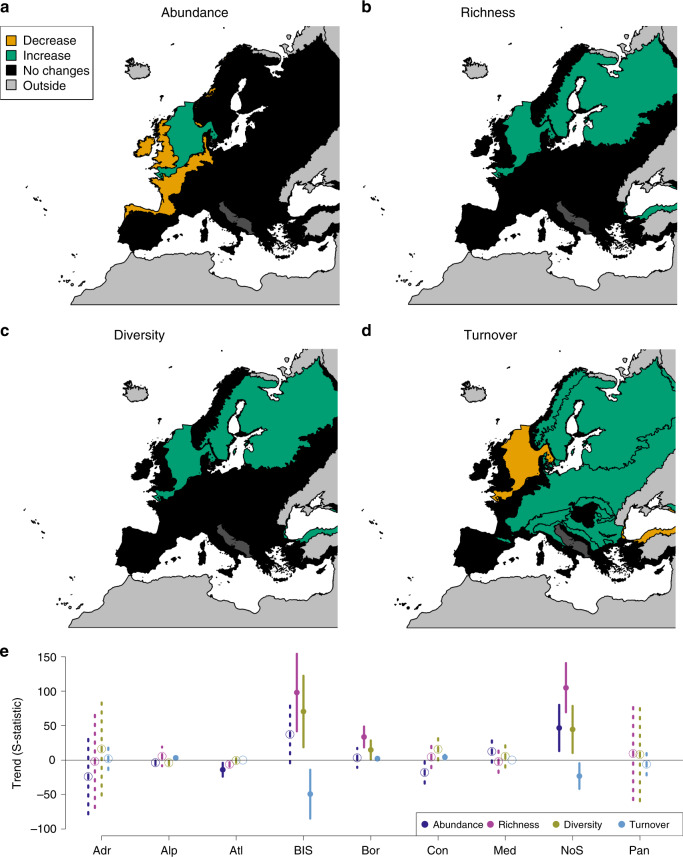
Fig. 2. Biodiversity trends in the different biogeoregions.
The results of meta-analysis mixed models are shown for the four studied biodiversity metrics: abundance (a), richness (b), diversity (c) and turnover (d). Green: significant increasing trends (p ≤ 0.05); orange: significantly declining trends (p ≤ 0.05); black (dark grey for Adriatic Sea): no significant trends (p > 0.05). For biogeoregion identity see Fig. 1. e Values of S-statistics (model estimated mean, error bar: +/− C.I.). Adr: Adriatic (n = 1 time series), Alp: Alpine (n = 33 time series), Atl Atlantic (n = 56 time series), BlS Black Sea (n = 5 time series), Bor Boreal (n = 32 time series), Con Continental (n = 17 time series), Med Mediterranean (n = 9 time series), NoS North Sea (n = 7 time series), and Pan Pannonian (n = 1 time series). Dark blue: abundance, pink: richness, yellow: diversity, light blue: turnover. Solid line and dot: p ≤ 0.05; dashed line and open circle: p > 0.05. Source data are provided as a Source Data file.

