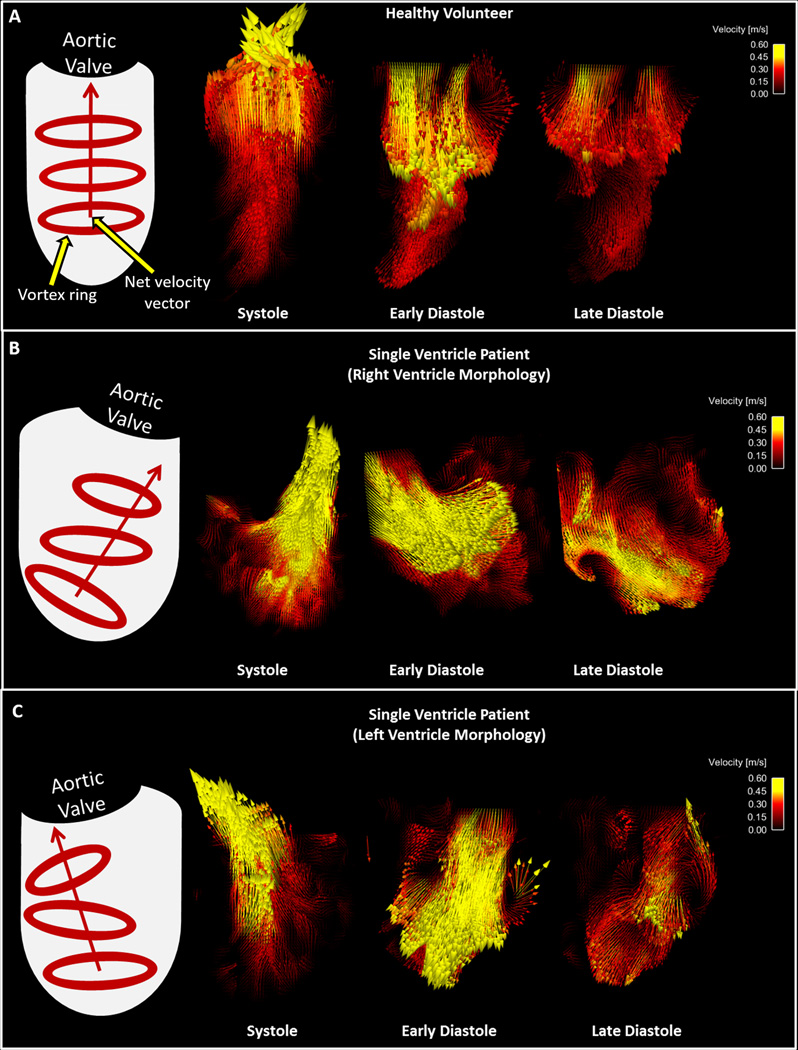
Figure 6.
Velocity vectors in the ventricles of a A) Healthy Volunteer and single ventricle patients with B) Right ventricle morphology and C) Left ventricle morphology during systole and diastole. Ventricle graphics on the left of the figure depict the trends overserved in vortex formation and net velocity vector direction for each group.

