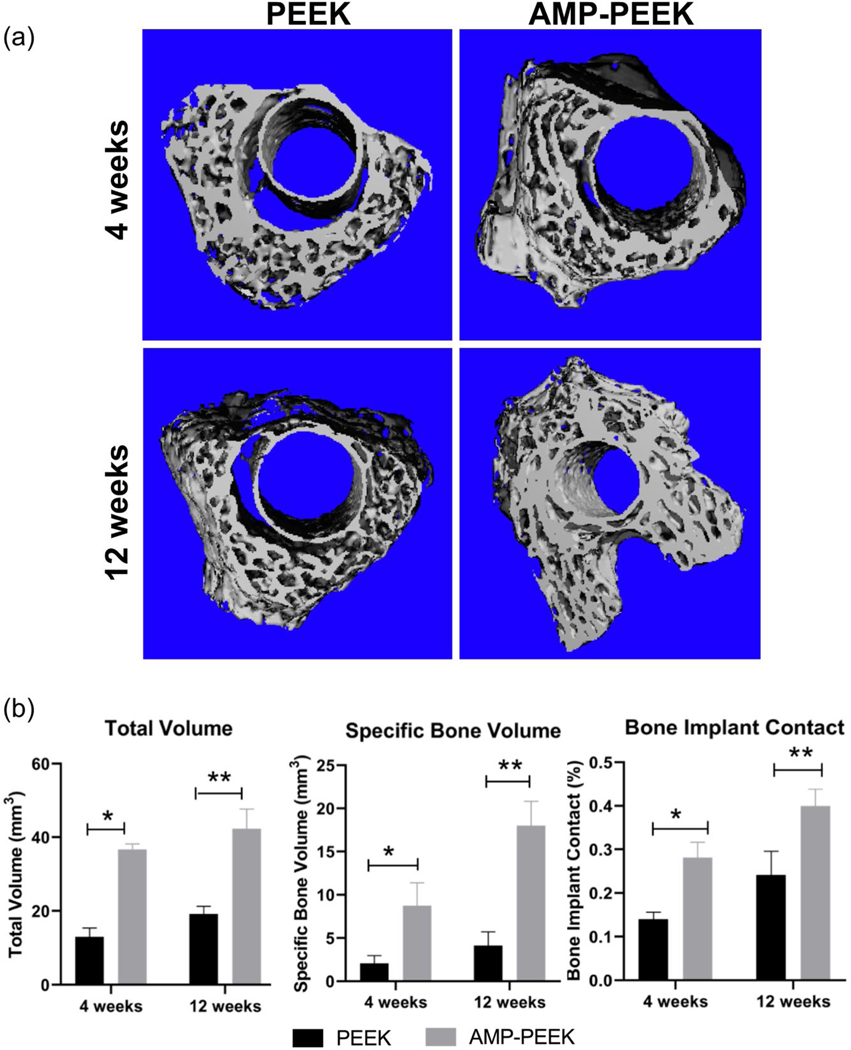
Figure 8.

(a) Representative micro-CT images showing 3-D reconstruction of the region near PEEK and AMP-PEEK implants after 4- and 12-weeks implantation. (b) Total volume, specific bone volume and bone-implant contact values of micro-CT analyses calculated as bone volume area and percentage of the total implant perimeter. Results are shown as area and mean percentages ± standard deviation. Various statistically significant differences are indicated by asterisk. Total Volume: * p=<0.0001; ** p=<0.0001; Specific Bone Volume: * p=<0.0001; *p= 0.0001. Bone Implant Contact: *p=0.0002; ** p=<0.0001.
