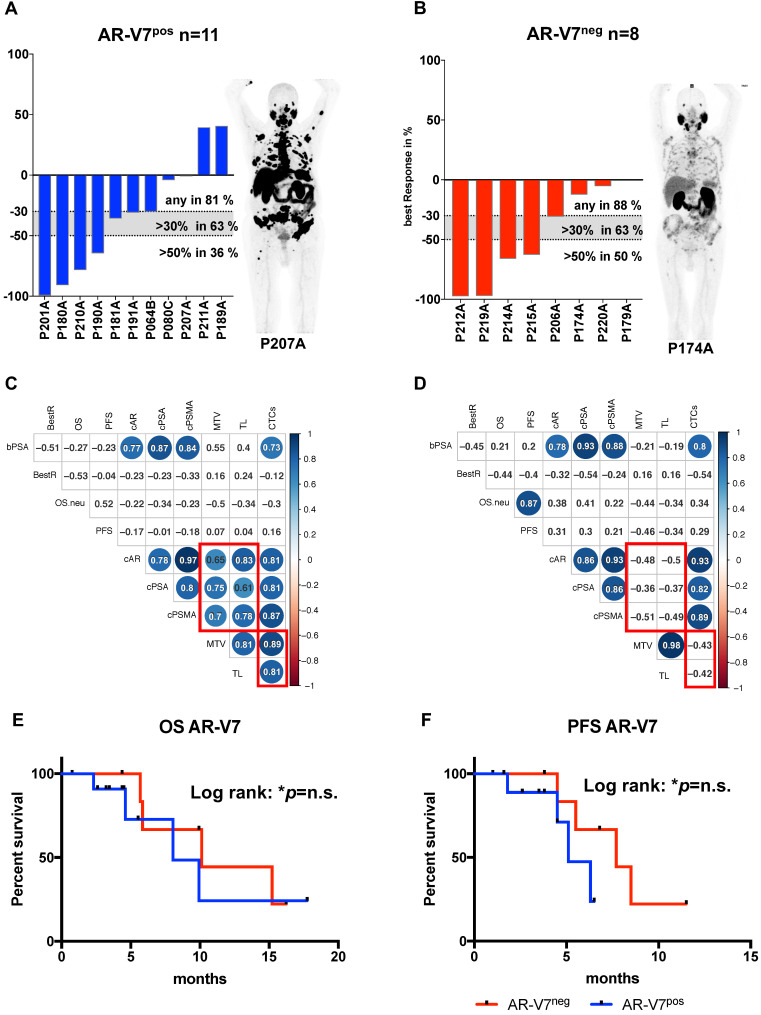
Figure 2.
AR-V7 expression subgroup analysis. Best PSA Response is presented for AR-V7pos (A) and AR-V7neg (B) patients. Dotted lines indicated established response tresholds of >30% and >50%. Representative PSMA PET images are shown for each group. Multiparameter correlation analysis is shown in corrplots created using the RStudio corrplot package. Circle size and colour is proportional to the respective Pearson coefficient (blue for positive, red for negative correlation) and significance (non-significant results with p>0.05 are shown as blank fields). Numbers indicate the precise Pearson value. OS (E) and PFS (F) is shown for AR-V7pos (blue) and AR-V7neg (red) patients. PSA: prostate-specific antigen; BestR: best response; OS: overall survival; PFS=progression-free survival; cAR: relative copy numbers of androgen receptor mRNA; cAR-V7: relative copy numbers of androgen receptor splice variant V7 mRNA cPSMA: relative copy numbers of prostate-specific membrane antigen mRNA; bPSA: serum prostate-specific antigen at baseline; CTC: circulating tumor cells; MTV: metabolic tumor volume.

