Figure 2.
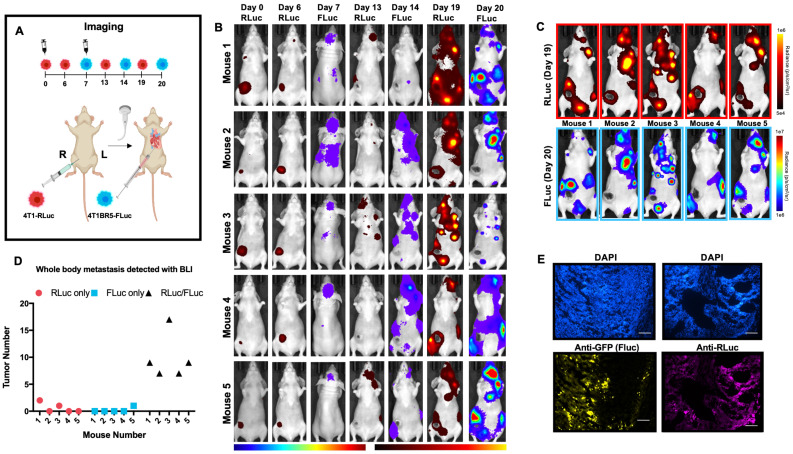
Experimental timeline for visualizing diagnostic CTCs (n=5) (A). RLuc BLI was performed on days 0, 6, 13 and 19 to visualize cells in the right MFP and any spontaneous metastases and FLuc BLI was performed on days 7, 14 and 20 to visualize CTCs; these images have not been scaled to enable the visualization of all lesions at each individual time point (B). FLuc-expressing CTCs efficiently homed to RLuc-expressing primary tumors and spontaneous metastases throughout the body (C). Quantitative analysis of endpoint BLI images (day 19 and 20) revealed that the vast majority of metastases were composed of both 4T1-RLuc and 4T1BR5-FLuc cells, which was significantly higher than the number of metastases that were either 4T1-RLuc-positive only or 4T1BR5-FLuc-positive only (p< 0.001) (C-D). The presence of both 4T1-RLuc and 4T1BR5-FLuc cells in a brain metastasis was confirmed histologically (scale bars= 500 microns) (E).

