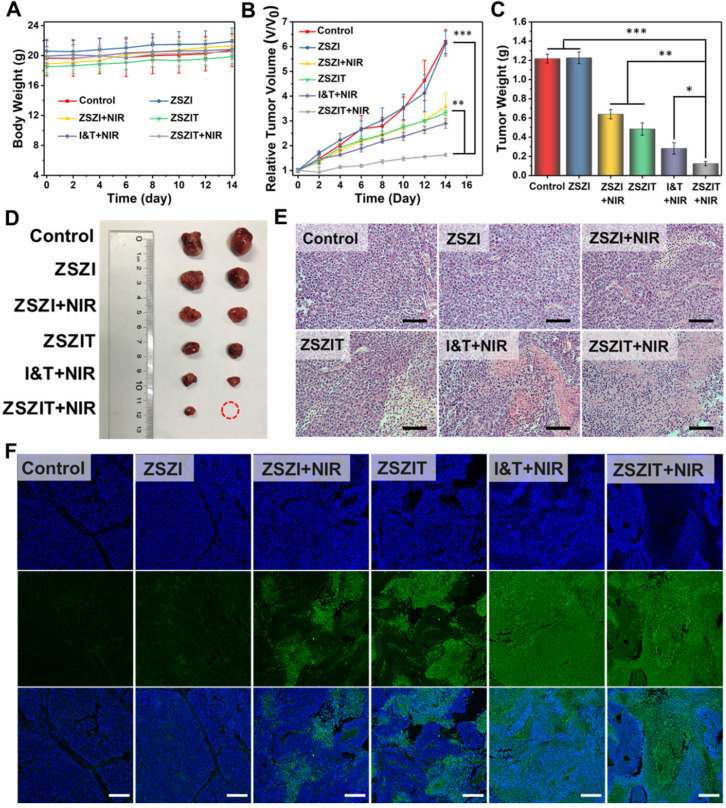
Figure 5.
(A) Body weight and (B) tumor volume of mice in the following 2 weeks after receiving treatments. (C) Tumor weight and (D) representative photograph of the tumors collected from different groups of mice at day 14. (E) H&E stained tumor slices from different groups (Scale bar: 50 µm). (F) TUNEL stained tumor slices from different groups (scale bar: 250 µm).

