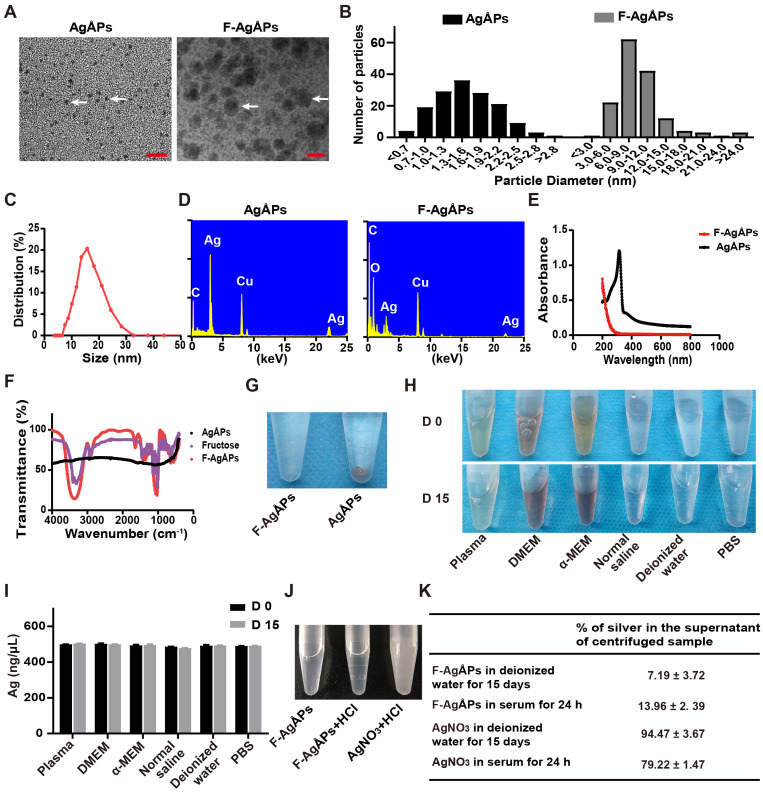
Figure 1.
Characterization of F-AgÅPs. (A) Morphologies of AgÅPs and F-AgÅPs under a transmission electron microscope. Scale bar: 10 nm. (B) Size distribution of AgÅPs (15.53 ± 5.1 Ång; n = 150) and F-AgÅPs (9.38 ± 4.11 nm; n = 150) under the transmission electron microscope. (C) Hydrodynamic diameter distribution of F-AgÅPs measured by DLS. (D) Elemental constitution of AgÅPs and F-AgÅPs analyzed by EDS. (E) UV-Vis-NIR absorption spectra of AgÅPs (black line) and F-AgÅPs (red line). (F) FT-IR absorption spectra of fructose (purple line), AgÅPs (black line) and F-AgÅPs (red line). (G) Photographs of AgÅPs and F-AgÅPs aqueous solutions left for one month at room temperature. (H and I) Photographs of F-AgÅPs in plasma, cell culture media (including DMEM and α-MEM), normal saline, deionized water and PBS left at room temperature for 15 days (H) and silver concentration in their supernatant measured by ICP-MS (I). n = 3 per group. (J) Photographs of F-AgÅPs and AgNO3 suspensions after being mixed with HCl. (K) The percentages of silver in the supernatant of the centrifuged F-AgÅPs and AgNO3 preparations in deionized water for 15 days and in serum for 24 h. n = 4 per group. Data are shown as mean ± SD. *P < 0.01, **P < 0.01, ***P < 0.001.

