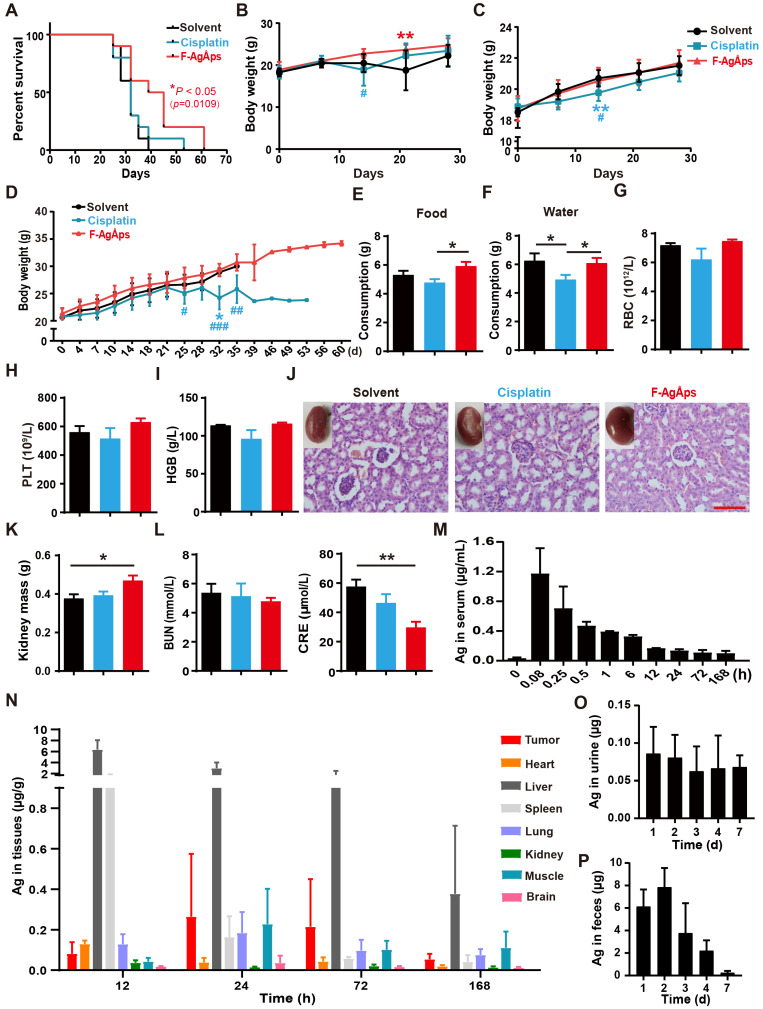
Figure 4.
Toxicities, pharmacokinetics, biodistribution and excretion of F-AgÅPs in osteosarcoma-bearing mice. (A) Kaplan-Meier survival curves of subcutaneous 143B-bearing mice. n = 10 per group. (B and C) Body weights of subcutaneous 143B (B) or orthotopic SJSA-1 (C) xenografts-bearing mice during the assessment of anti-tumor efficacy of F-AgÅPs. n = 6 per group. (D) Body weights of mice in (A) were record twice a week until all mice died. (E and F) Food and water consumption of mice in (A) were monitored from day 21 to 28. Average daily food (E) and water (F) intakes were shown. n = 8-10 per group. (G-I) The numbers/levels of RBC (G), PLT (H) and HGB (I) in blood samples from mice in (B) at days 21. n = 5 per group. (J) Gross view and H&E staining images of kidneys from mice in (B) at days 21. Scale bar: 100 µm. (K) The weights of kidney. n = 6 per group. (L) The serum levels of BUN and CRE. n = 5 per group. (M) Blood concentration-time curve of silver in orthotopic SJSA-1-bearing mice untreated (0 min) or treated with F-AgÅPs for the indicated times. n = 5 per time point. (N) Tissue distribution of silver after F-AgÅPs treatment for the indicated times. n = 5 per time point. (O and P) Daily excretion levels of silver through urine (O) and feces (P). n = 5. Data are shown as mean ± SD.*#P < 0.05, **/##P < 0.01, ***/###P < 0.001. For (B-D): *P < 0.05 vs. solvent group, #P < 0.05 vs. F-AgÅPs group.

