Figure 6.
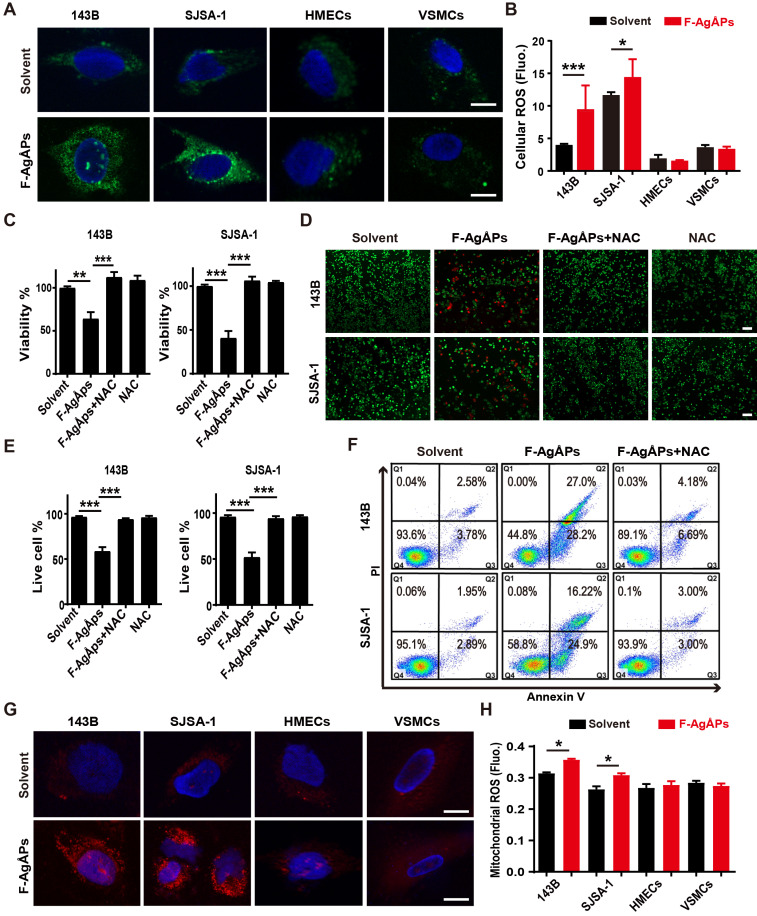
ROS-dependent apoptosis mediates F-AgÅPs-induced osteosarcoma cell death. (A) DCFH-DA staining of intracellular ROS in 143B and SJSA-1 treated with solvent or IC50 doses of F-AgÅPs for 24 h. Scale bar: 20 µm. (B) Intracellular ROS levels in 143B, SJSA-1, HMECs and VSMCs treated with solvent or IC50 doses of F-AgÅPs for 24 h were measured by DCFH-DA staining using a fluorescence microplate reader. Fluo: fluorescence. n = 5 per group. (C) CCK-8 analysis of the viability of 143B and SJSA-1 treated with solvent, F-AgÅPs, NAC or F-AgÅPs + NAC for 24 h. n = 5 per group. NAC: N-acetylcysteine. (D and E) Representative images of calcein-AM/PI double staining of 143B and SJSA-1 receiving different treatments for 24 h (D) and quantification of the percentages of live cells (E). Scale bar: 100 µm. n = 3 per group. (F) Flow cytometric analysis of Annexin V-FITC/PI-stained 143B and SJSA-1 receiving different treatments for 24 h. (G) Representative images of MitoSOX Red staining of mitochondrial ROS in 143B and SJSA-1 receiving different treatments for 24 h. Scale bar: 20 µm. (H) Mitochondrial ROS levels in 143B, SJSA-1, HMECs and VSMCs receiving different treatments for 24 h were tested by MitoSOX Red staining using a fluorescence microplate reader. n = 5 per group. Data are shown as mean ± SD.*P < 0.05,**P < 0.01, ***P < 0.001.

