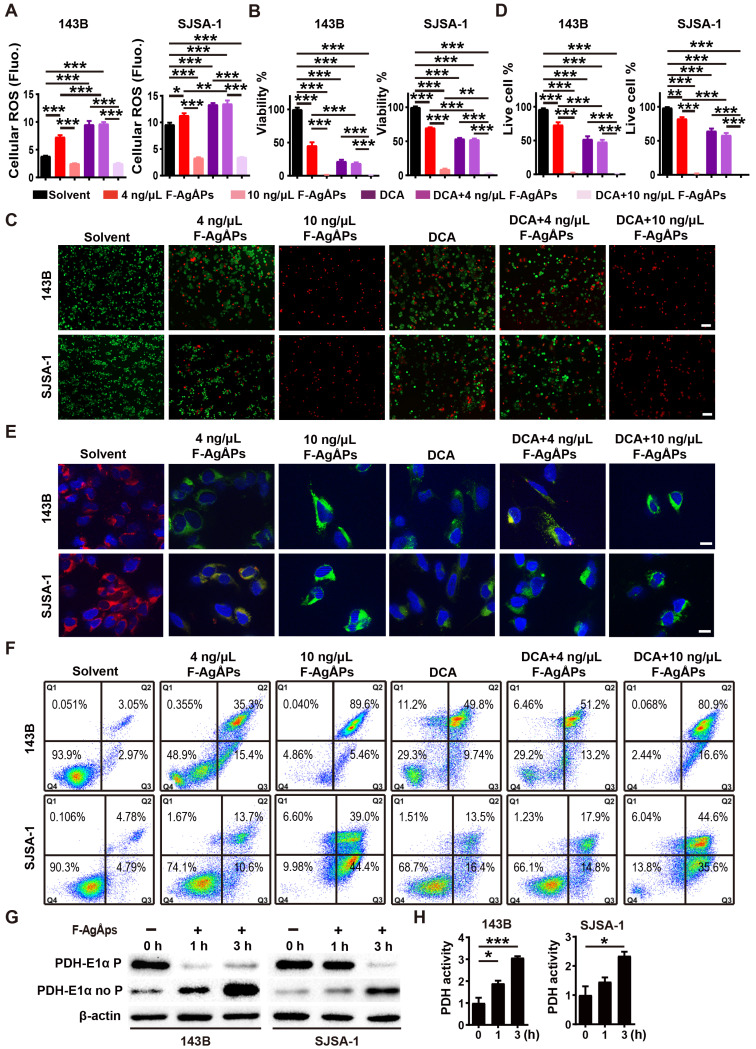
Figure 8.
Inhibition of PDK contributes to F-AgÅPs-induced ROS production, ΔΨm reduction and apoptosis of osteosarcoma cells. (A) Intracellular ROS levels in 143B and SJSA-1 receiving different treatments for 24 h were measured by DCFH-DA staining with a fluorescence microplate reader. DCA: dichloroacetate. n = 5 per group. (B) CCK-8 analysis of the viability of 143B and SJSA-1 receiving different treatments for 24 h. n = 5 per group. (C and D) Representative calcein-AM/PI staining images of 143B and SJSA-1 receiving different treatments for 24 h (C) and quantification of the percentages of live cells (D). n = 3 per group. (E) Representative JC-1 staining images of 143B and SJSA-1 receiving different treatments for 24 h. Scale bar: 50 µm. (F) Flow cytometric analysis of Annexin V-FITC/PI-stained 143B and SJSA-1 receiving different treatments for 24 h. (G) Western blotting for non-phosphorylated and phosphorylated E1α subunit of PDH protein. (H) PDK activity assay of 143B and SJSA-1 receiving different treatments for 1 h or 3 h. n = 3 per group. Data are shown as mean ± SD. *P < 0.05,**P < 0.01, ***P < 0.001.

