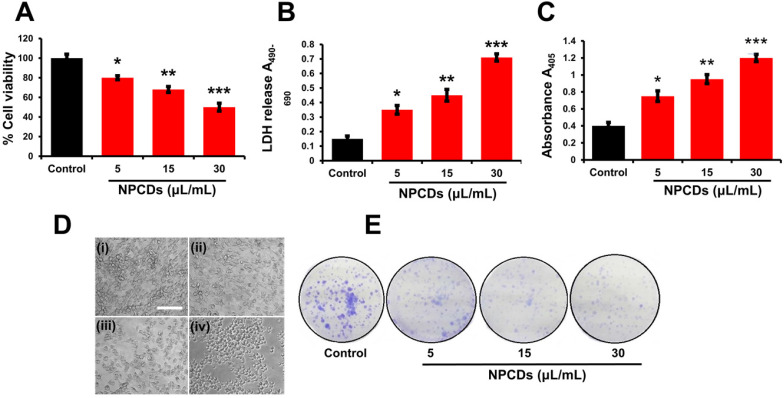
Figure 3.
Cytotoxic potential of nitrogen-/phosphorous-doped carbon dots (NPCDs) against B16F10 melanoma cells. (A and B) MTT and LDH assay, respectively of the NPCDs (0-30 μL/mL)-treated cells after 24 h of incubation. (C) Apoptosis assay after treatment with NPCDs measured at A405 (D) Morphological changes in B16F10 cells after treatment with NPCDs (0-30 μL/mL). Images were captured at 20× magnification [scale bar =0.1 mm]. (E) Clonogenic assay where B16F10 cells were cultured in the presence and absence of NPCDs over 7 days, and then subjected to crystal violet staining. Each value in the bar graph represents the mean ±SD of three independent experiments. Values with different superscripts differ significantly from each other (P < 0.05).

