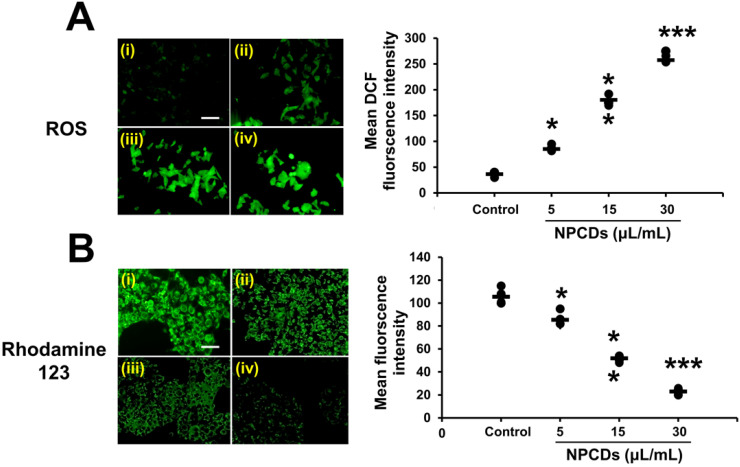
Figure 6.
Nitrogen-/phosphorous-doped carbon dots (NPCDs; 0-30 μL/mL)-induced cytosolic and mitochondrial ROS production in B16F10 melanoma cancer cells. (A) cytosolic ROS production determined by H2DCFDA counterstaining with DAPI and (B) Rhodamine 123 staining detected by fluorescence microscopy. Fluorescence intensities of (C) cytosolic and (D) mitochondrial ROS showing results corresponding to (i) the control and (ii) 5, (iii) 15, and (iv) and 30 μL/mL of NPCDs. ImageJ software was used to plot their respective intensities. Fluorescence images were captured at 20× magnification (scale bar = 0.1 mm). The data are represented as the mean ± standard deviation (SD) of three independent experiments: ***P < 0.001, **P < 0.01, * P < 0.05 vs. the control.

