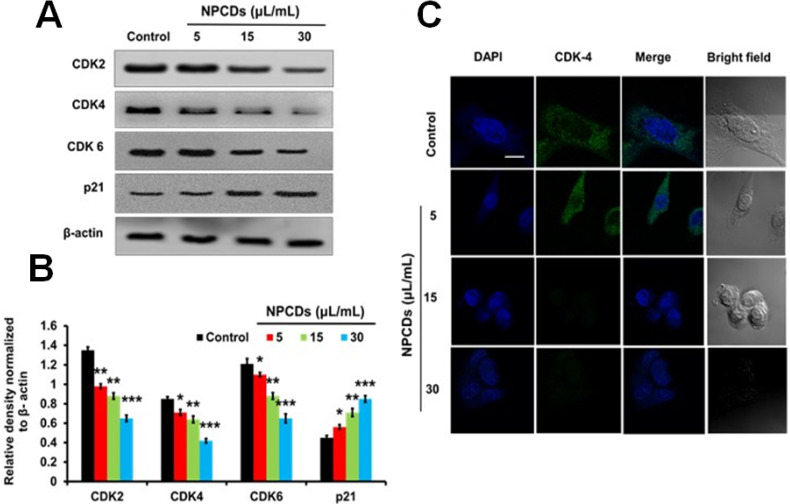
Figure 7.
Effect of nitrogen-/phosphorous-doped carbon dots on cell cycle arrest markers. (A) Western blot analysis of various cell cycle arrest markers (CDK-2, -4, and -6 and p21) and (B) ImageJ analysis of B16F10 melanoma cancer cells after treatment with nitrogen-/phosphorous-doped carbon dots (NPCDs; 0-30 μL/mL). (C) Immunocytochemistry of cell cycle arrest marker CDK-4 after treatment with NPCDs evaluated via confocal microscopy. The data are represented as the mean ± standard deviation (SD) of three independent experiments: ***P < 0.001, **P < 0.01, * P < 0.05 vs. the control.

